


Here’s the part nobody tells you: by the time your local weatherman says “cold winter ahead” on the evening news, meteorologists have already spent six weeks quietly building that forecast out of satellite data, ocean buoys, and stratospheric wind readings. The groundhog is a mascot. The wooly worm is a folk tale. The real winter forecast starts working the moment the first September leaf hits the ground, and almost nobody outside the field knows where to look.
What’s wild is that most of this data is public. It’s sitting on NOAA’s website right now, updating weekly, while the rest of us wait for a press release. So what exactly are professional forecasters watching in the first weeks of fall that lets them start whispering about polar vortex collapses and lake-effect mega-snows before Halloween candy even hits the shelves? There are seventeen signals, and once you know them, you’ll never look at a September weather map the same way again.
#1 – The El Niño/La Niña Signal Locks In Before Halloween
🔥 Would you like to save this?
We'll email this post to you, so you can come back to it later!
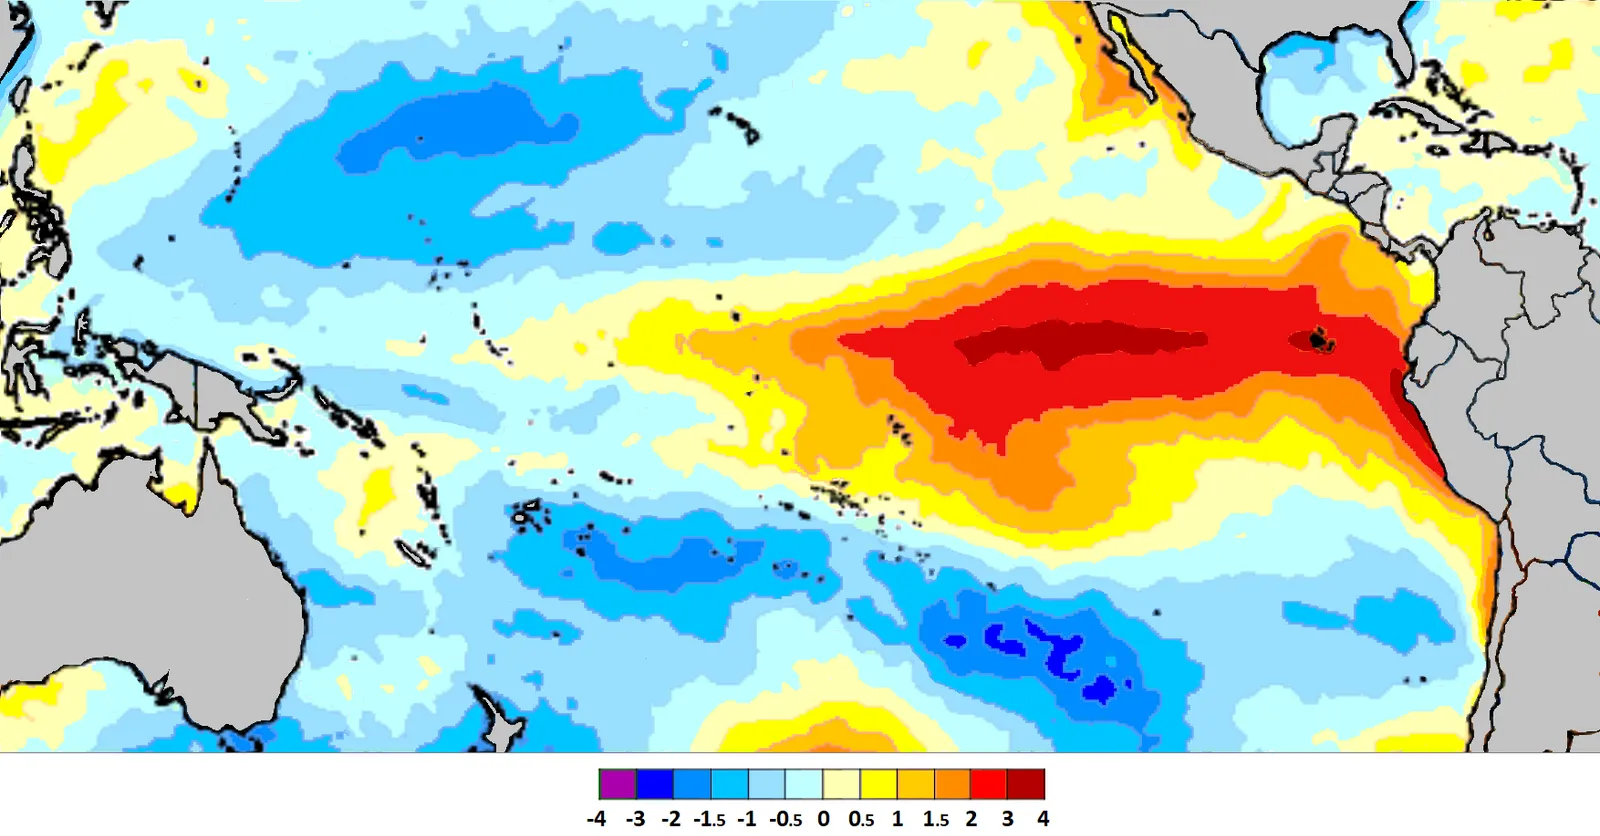
Forecasters don’t wait for winter to check on El Niño or La Niña. They’re tracking sea surface temperatures across the equatorial Pacific every single week starting in early fall, because this one ocean pattern is arguably the single biggest driver of winter weather across all of North America. It shapes everything from how much rain soaks the Gulf Coast to exactly where the jet stream parks itself over the Rockies.
By September, NOAA’s Climate Prediction Center already has enough data in hand to issue confident seasonal outlooks. That’s because ENSO (El Niño-Southern Oscillation) patterns rarely flip dramatically between fall and winter once they’ve established themselves. A La Niña signature typically means a mild, dry southern U.S. paired with a stormier Pacific Northwest. El Niño flips that script almost entirely, dragging moisture south and quieting things down up north.
What genuinely frustrates professional forecasters is watching this get ignored in casual, viral winter predictions. The ocean temperature anomaly numbers aren’t secret. Anyone with an internet connection can pull them up right now and see which way the season is leaning. But even this well-known signal pales next to what forecasters find buried in the Arctic ice charts.
Quick Compare
- La Niña winters: Milder, drier South paired with a stormier, wetter Pacific Northwest
- El Niño winters: Wetter, stormier South with a calmer, drier North
- Neutral years: Jet stream patterns get harder to pin down and tend to swing more week to week
#2 – September Sea Ice Levels Act Like a Report Card for the Whole Season
🔥 Would you like to save this?
We'll email this post to you, so you can come back to it later!
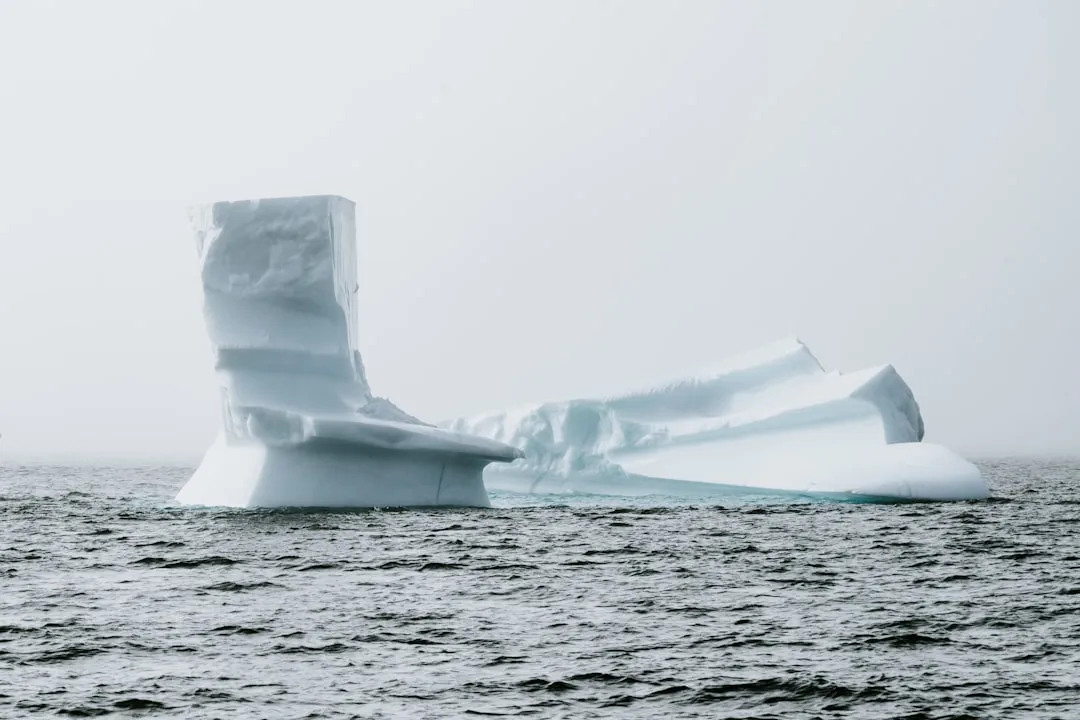
September marks the annual low point for Arctic sea ice, and forecasters treat that single number like a report card for the entire winter ahead. Less ice means more open, dark ocean water sitting exposed to the sun, soaking up heat that a frozen surface would have simply reflected away.
That absorbed heat doesn’t just vanish once the sun goes down for the Arctic winter. It gets released back into the atmosphere throughout fall, and this delayed heat release turns out to be one of the most reliable early clues to how erratic winter’s temperature swings will be. Low ice years have repeatedly correlated with a weaker, wavier jet stream by the time January rolls around.
A wavier jet stream might sound like a harmless technicality, but it’s the exact mechanism behind those brutal cold-air outbreaks that plunge disproportionately into places like Texas and the Southeast, even while the Arctic itself is running unusually warm. When forecasters start mentioning “polar vortex disruption” risk back in October, they’re not speculating. They’re reading it straight off the ice charts from six weeks earlier.
#3 – A Fast Siberian Snow Advance Is the Red Flag Almost Nobody Notices
🔥 Would you like to save this?
We'll email this post to you, so you can come back to it later!
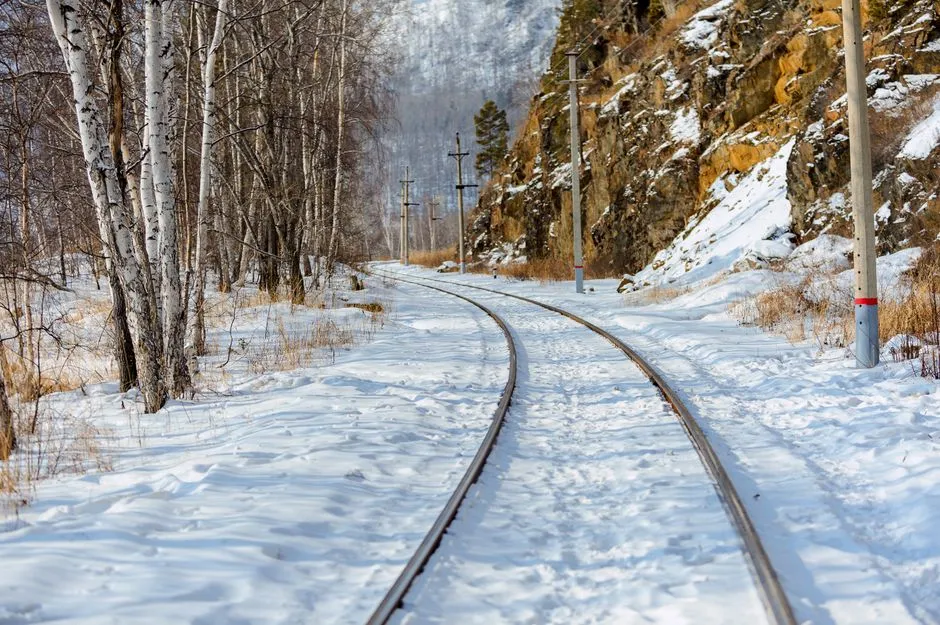
This is one of the lesser-known tricks in the forecasting toolbox, and it’s become one of the most trusted. Meteorologists track exactly how quickly snow cover expands across Siberia during October, because a rapid snow advance across Eurasia has been statistically linked to a weaker, more easily disrupted polar vortex later in winter.
The theory, developed by climate scientist Judah Cohen, works in a chain reaction. Fast-building Siberian snow cools the air sitting above it, and that cooling strengthens high-pressure ridges capable of bending, and eventually breaking apart, the polar vortex. Once that vortex weakens, cold air that’s normally locked up over the Arctic starts spilling south into places that rarely see it.
This isn’t folklore dressed up in scientific language. It’s one of the most cited seasonal outlook tools among professional winter forecasters working today, and the calculations are already running while most of the country is still out raking leaves in the driveway.
#4 – The Polar Vortex’s Shape Gets Watched Like a Hawk
🔥 Would you like to save this?
We'll email this post to you, so you can come back to it later!
Most people only hear the phrase “polar vortex” once a brutal cold snap is already underway on the news. Forecasters, meanwhile, are analyzing its shape and strength months earlier. A tight, strong, symmetrical vortex tends to trap cold air up north and keep the Lower 48 milder overall through the season.
A stretched, wobbly, or displaced vortex tells a completely different story. Early positioning clues picked up in September and October give forecasters a preview of whether that vortex is prone to “stretching” events later on, the kind that funnel Arctic air straight south mid-winter.
Forecasters cross-reference vortex behavior with stratospheric temperature anomalies roughly 10 millibars up, essentially checking the health of the atmosphere eighteen miles above your head to predict what happens at ground level weeks later. It sounds like science fiction, but it’s routine meteorology.
#5 – Where the Jet Stream First Dips Is the Winter’s Movie Trailer
🔥 Would you like to save this?
We'll email this post to you, so you can come back to it later!
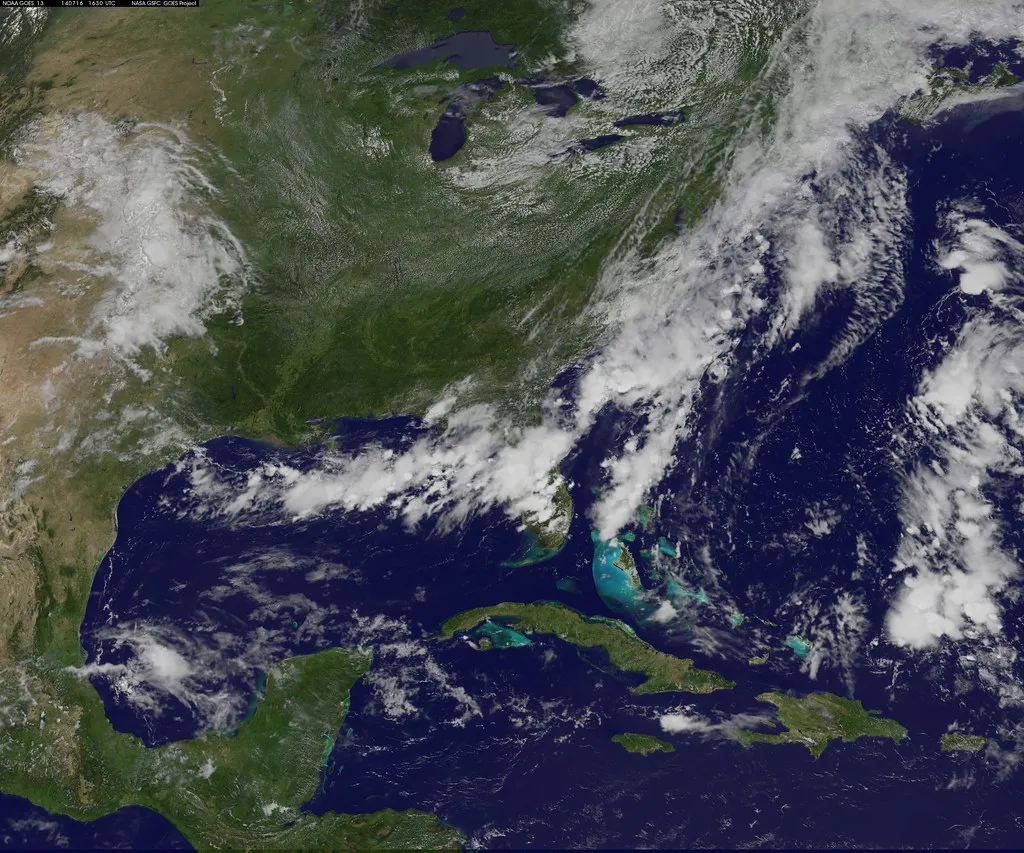
The jet stream’s early autumn behavior functions almost like a preview trailer for the winter to come. Forecasters watch closely for exactly where the first major troughs, or dips, and ridges, or bulges, set up during September and October.
A persistent trough parked over the eastern U.S. in fall frequently becomes a recurring “cold lock” pattern that repeats all winter long, while a ridge sitting over that same region tends to signal a mild, storm-starved season instead. It’s a pattern that tends to entrench itself rather than reshuffle.
This is exactly why some parts of the country get a legitimate early heads-up while others get almost nothing at all. If the jet stream is already behaving erratically by October, that volatility rarely calms down on its own. More often, it intensifies once winter’s sharper temperature gradients kick in.
#6 – Pacific Ocean “Blobs” Quietly Reroute Entire Storm Tracks

🔥 Would you like to save this?
We'll email this post to you, so you can come back to it later!
Beyond the classic El Niño/La Niña measurement, forecasters also track smaller, regional sea surface temperature anomalies out in the North Pacific, informally nicknamed “blobs” of unusually warm or cool water. These pockets can shift the entire storm track feeding moisture into the western U.S.
A warm blob near the Gulf of Alaska in early fall has previously been connected to a persistent ridge that blocks Pacific storms from ever reaching California, feeding drought conditions that stretch well into winter. A cooler anomaly does the opposite, swinging the door wide open for a wetter storm parade up and down the coast.
This level of granular detail rarely makes it into casual, shareable winter predictions online. But it’s a staple metric for any professional outlook that claims real regional accuracy instead of a vague, one-size-fits-all national guess.
#7 – Atlantic Ocean Warmth Quietly Decides the East Coast’s Fate

🔥 Would you like to save this?
We'll email this post to you, so you can come back to it later!
While the Pacific gets most of the public attention, forecasters are just as locked in on Atlantic Ocean temperature patterns heading into winter. Warmer-than-average water off the East Coast during September and October tends to fuel more moisture and energy for coastal storm systems down the line.
This single factor plays a major role in whether the I-95 corridor sees a genuinely snowy winter or a wet, rain-heavy one, because it directly affects how much a coastal low can intensify. It’s the difference between a forgettable slushy rain event and a full-blown Nor’easter that shuts down three states.
Forecasters also watch this pattern in tandem with the North Atlantic Oscillation, since the two together dictate whether all that stored-up Atlantic energy actually slams into the coastline or gets steered harmlessly out to sea instead.
#8 – September Storm Tracks Rarely Reset by December
🔥 Would you like to save this?
We'll email this post to you, so you can come back to it later!
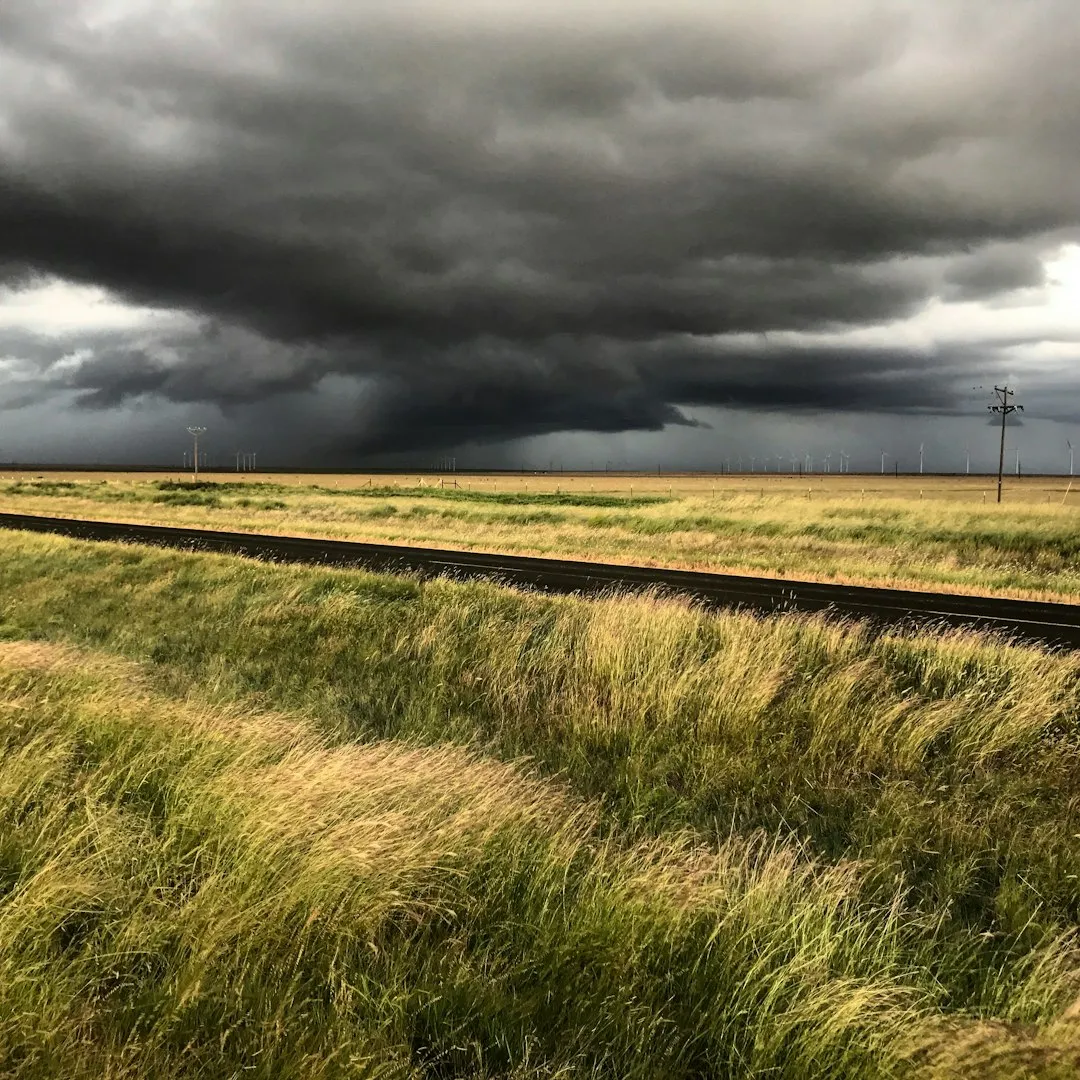
Meteorologists pay very close attention to where storms are already tracking during the first weeks of fall, because large-scale steering patterns tend to persist rather than reset overnight. If storms are consistently sliding through the Ohio Valley in September, forecasters flag that as a likely recurring theme for the months ahead.
Persistent early-fall storm tracks have a strong tendency to become the “default” pathway that repeats through the winter months, simply because the broader atmospheric blocking patterns steering them don’t shift dramatically in a matter of weeks.
This is exactly why forecasters get nervous watching the same track repeat three or four times in a single September. It’s often a preview of the precise regions that will get hammered, or completely skipped, once real winter storms start forming in earnest.
#9 – A Little-Known Tropical Pulse Predicts Early Cold Snaps
🔥 Would you like to save this?
We'll email this post to you, so you can come back to it later!
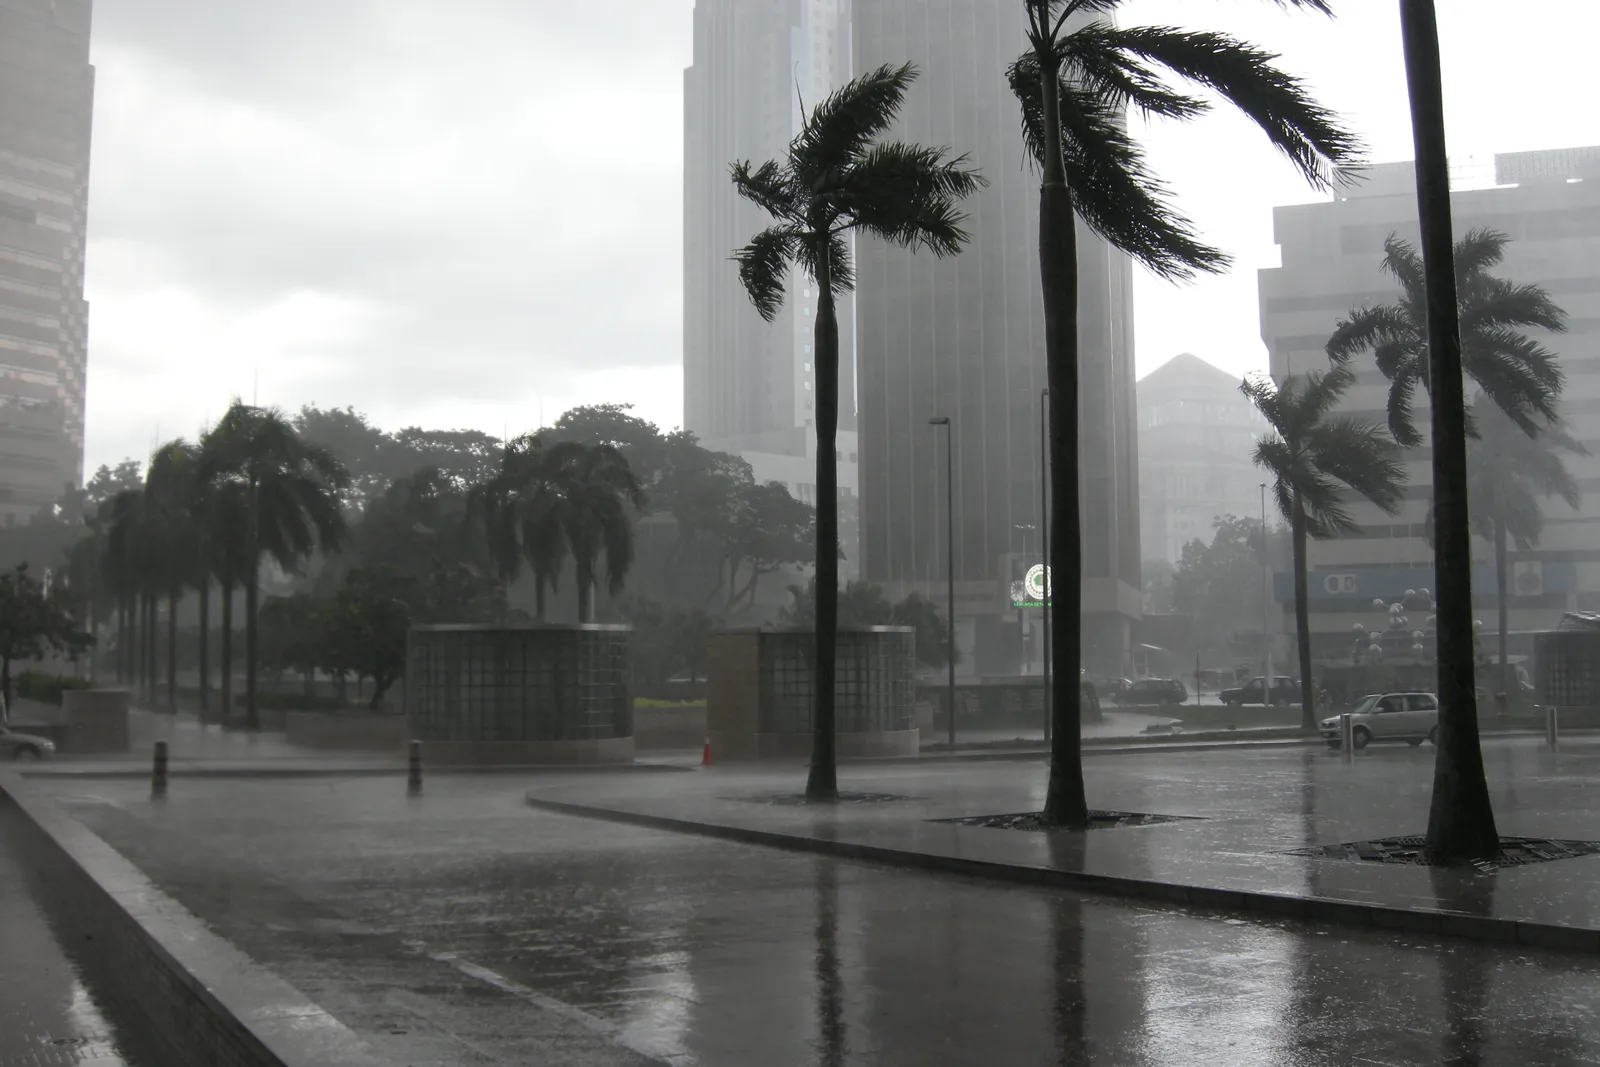
Few casual weather watchers have even heard of the Madden-Julian Oscillation, or MJO, but it’s a critical short-to-medium range tool forecasters lean on heavily in early fall. This traveling pulse of tropical thunderstorm activity circles the entire globe every 30 to 60 days, and it can trigger specific temperature and precipitation patterns two to three weeks before they arrive.
Certain MJO phases showing up in October have been linked to increased odds of early cold outbreaks reaching the central and eastern U.S. That gives forecasters a legitimate scientific basis for saying “expect an early taste of winter” weeks before it actually happens, rather than a hunch.
It’s a niche tool that most of the public will never hear named on TV, but it’s become indispensable for bridging the gap between short-term forecasting and the broader seasonal outlook.
Fast Facts
- The MJO completes a full lap around the globe roughly every 30 to 60 days
- Unlike ENSO, which sits fixed in the Pacific, the MJO physically travels eastward across the tropics
- Certain phases are more closely tied to early cold intrusions reaching the central and eastern U.S.
- Forecasters mainly use it for two-to-three-week outlooks rather than full-season predictions
#10 – A Stubborn North Atlantic Oscillation Signals a Blocked-Up Winter
🔥 Would you like to save this?
We'll email this post to you, so you can come back to it later!
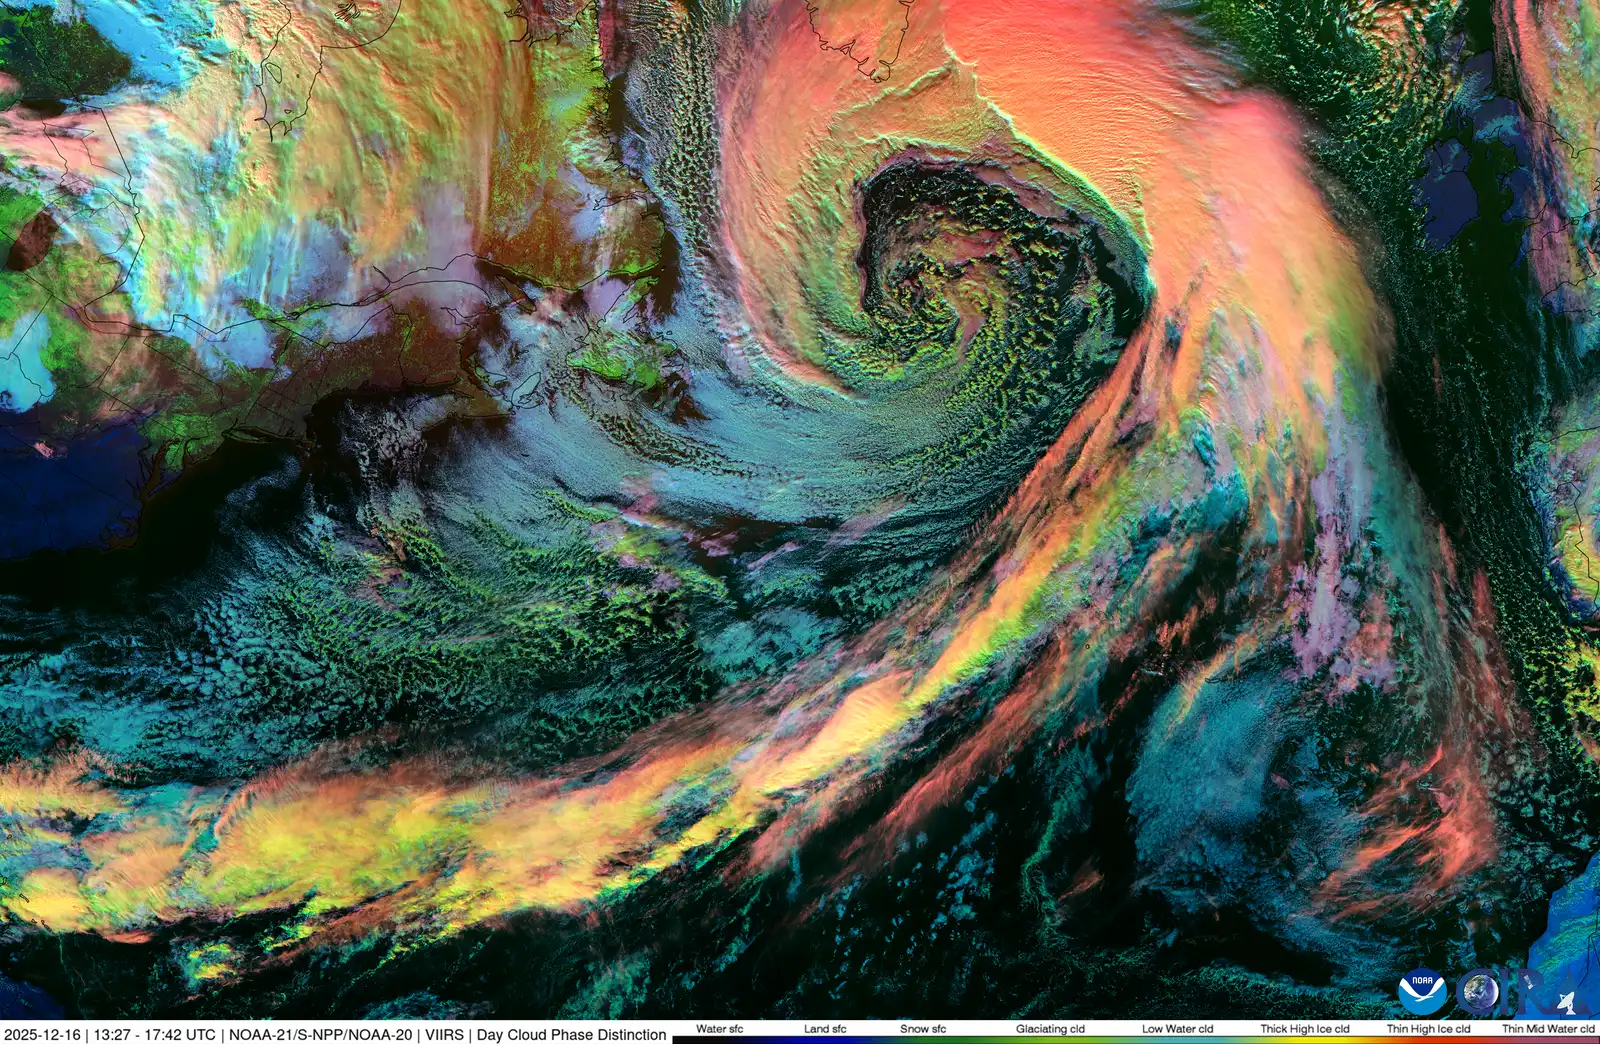
The North Atlantic Oscillation, or NAO, measures the pressure difference between Iceland and the Azores, and its behavior in fall gives forecasters a strong hint about blocking patterns later in winter. A negative NAO phase tends to favor blocking high pressure near Greenland, which can shove cold air southward into the eastern U.S.
A persistently negative NAO signature emerging in October has historically preceded some of the snowiest, most blocked-up winters on record for the Northeast and Mid-Atlantic. It’s a small pressure differential with outsized consequences for anyone who owns a snow shovel.
Forecasters watch for early trends in this index the same way stock analysts watch market indicators, because small shifts in September and October can compound into major seasonal consequences once winter fully sets in.
#11 – A Technical-Sounding Wind Pattern That Predicts Vortex Chaos
🔥 Would you like to save this?
We'll email this post to you, so you can come back to it later!
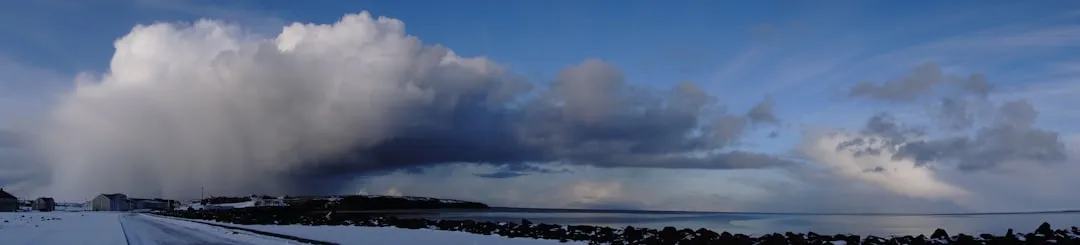
The Quasi-Biennial Oscillation, or QBO, tracks the direction of stratospheric winds high above the equator, flipping between “easterly” and “westerly” phases roughly every two years. It sounds completely disconnected from your local forecast, but it isn’t.
A westerly QBO phase heading into winter has been associated with a stronger, more stable polar vortex. An easterly phase, on the other hand, raises the odds of vortex disruptions and the cold outbreaks that follow them.
Forecasters cross this data with the polar vortex and Siberian snow signals mentioned earlier, because no single indicator ever works in isolation. It’s the overlap of several signals all pointing the same direction that gives a forecast real confidence.
#12 – Early Warning Signs of a Sudden Stratospheric Warming Event
🔥 Would you like to save this?
We'll email this post to you, so you can come back to it later!
One of the most dramatic winter wildcards is a Sudden Stratospheric Warming event, where temperatures in the stratosphere spike dramatically over just a matter of days. That spike disrupts the polar vortex and often triggers severe cold outbreaks two to six weeks later, seemingly out of nowhere.
Forecasters can’t pinpoint the exact date months in advance, but they do watch precursor signals, like wave activity propagating upward from the troposphere, that tend to build steadily through autumn. A high frequency of these upward-propagating wave events in October and November significantly raises the odds of an SSW event disrupting winter down the line.
This is exactly the kind of behind-the-scenes science that explains why a “quiet” winter can suddenly turn brutal in a matter of days, catching casual forecast-watchers completely off guard.
#13 – Dry Ground in Autumn Means Sharper Temperature Swings All Winter
🔥 Would you like to save this?
We'll email this post to you, so you can come back to it later!
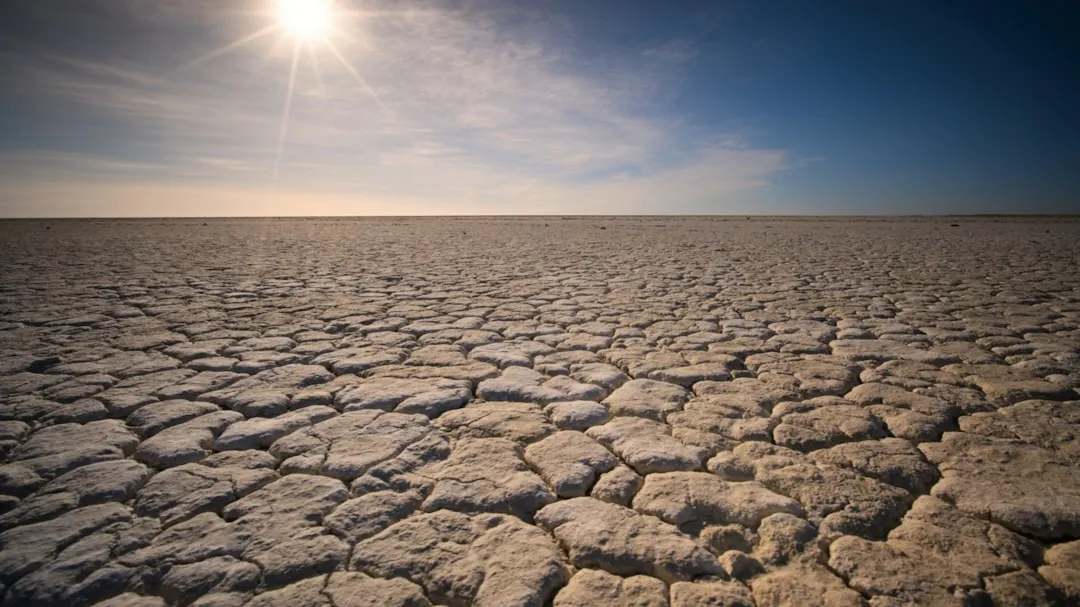
It might seem completely unrelated, but the amount of moisture sitting in the ground during early fall genuinely affects winter temperature patterns. Dry soil heats and cools much faster than moist soil does, which can amplify both daytime warmth and overnight cold well beyond normal ranges.
Regions heading into winter with significant drought conditions tend to experience more extreme temperature swings, because the ground itself isn’t buffering the atmosphere the way it normally would in a wetter year. The land essentially loses its thermal shock absorber.
Forecasters overlay drought monitor maps directly onto their seasonal outlooks, specifically because this factor tends to get completely overlooked by the public, even though it measurably affects how “sharp” a cold snap or thaw will feel on the ground.
Worth Knowing
- Dry soil can swing daily temperatures noticeably more than moist ground in the same location
- Drought-stressed regions often see both hotter afternoons and colder overnight lows heading into winter
- The U.S. Drought Monitor updates on a weekly basis and feeds directly into seasonal outlook models
#14 – An Early Hard Freeze Is Cold Air Announcing Itself Ahead of Schedule
🔥 Would you like to save this?
We'll email this post to you, so you can come back to it later!
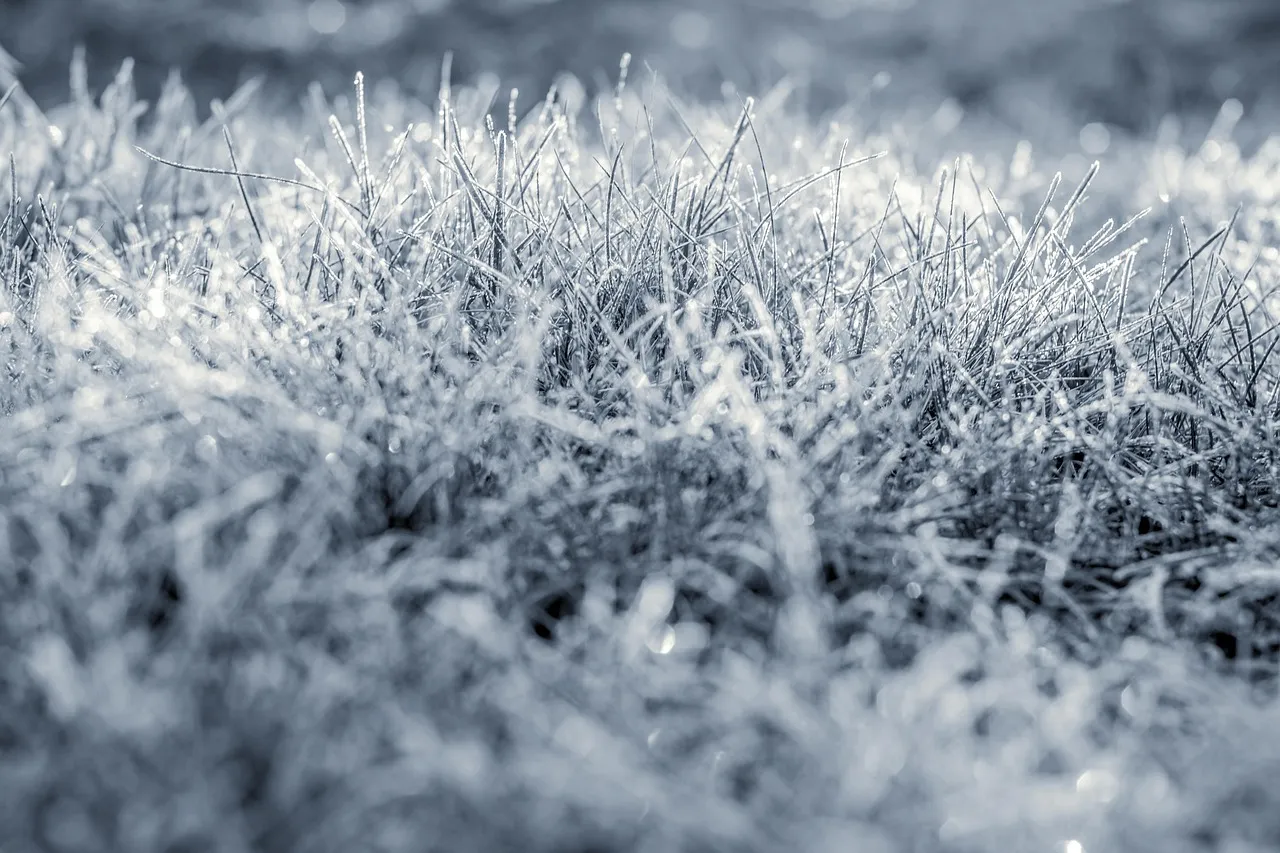
An unusually early or late first hard freeze isn’t just a gardening inconvenience that ruins your tomato plants. Forecasters use its timing as a rough proxy for how much cold air is already building and sinking down into the continent from the north.
An early freeze suggests cold air masses are already organizing further south than usual, well ahead of the calendar. A first freeze arriving one to two weeks ahead of the historical average has frequently coincided with winters featuring more frequent, if not necessarily more intense, cold air intrusions.
It’s not a perfect predictor standing alone, but combined with jet stream and vortex data, it adds one more data point either supporting or contradicting the broader seasonal theory forecasters are quietly building week by week.
#15 – Warm Great Lakes Water Sets Up the Biggest Snow Bombs

🔥 Would you like to save this?
We'll email this post to you, so you can come back to it later!
For anyone living near the Great Lakes, this one matters enormously. Forecasters track lake surface temperatures closely throughout September and October, because warmer water holds onto its heat much longer into the season, delaying ice formation for weeks.
Warmer-than-average Great Lakes temperatures heading into winter typically fuel more intense and prolonged lake-effect snow events. That’s because the temperature contrast between the still-warm water and incoming cold air masses is exactly what generates those extreme snowfall bands in the first place.
Ironically, a milder autumn on the lakes can translate directly into more dramatic snow totals for cities like Buffalo, Erie, and Syracuse once the cold air finally does arrive. The warmer the fall, the harder the eventual snow can hit.
At a Glance
- Classic lake-effect snowbelt cities include Buffalo, Erie, Syracuse, and Cleveland
- Shallow Lake Erie freezes fastest, which often shuts off its lake-effect snow supply first
- Deeper lakes like Michigan and Ontario stay open longer, fueling snow well into January
- A milder autumn can delay ice-over and effectively extend the entire lake-effect season
#16 – A Wild Hurricane Season Can Hint at the Coming Cold

🔥 Would you like to save this?
We'll email this post to you, so you can come back to it later!
It sounds like a stretch on the surface, but Atlantic hurricane season activity in September actually correlates with the broader atmospheric patterns forecasters use for winter outlooks. An active, storm-heavy season often reflects a particular configuration of Atlantic sea surface temperatures and wind shear that tends to persist right into the cooler months.
A hyperactive hurricane season has, in multiple past years, coincided with a milder start to winter across the Southeast, followed by a much sharper turn toward cold once the underlying pattern finally flips.
Forecasters don’t use hurricane activity as a standalone predictor by any means, but it’s one more thread in the tapestry of atmospheric behavior that carries forward from fall straight into winter.
#17 – Analog Years Are the Final Puzzle Piece That Ties It All Together
🔥 Would you like to save this?
We'll email this post to you, so you can come back to it later!
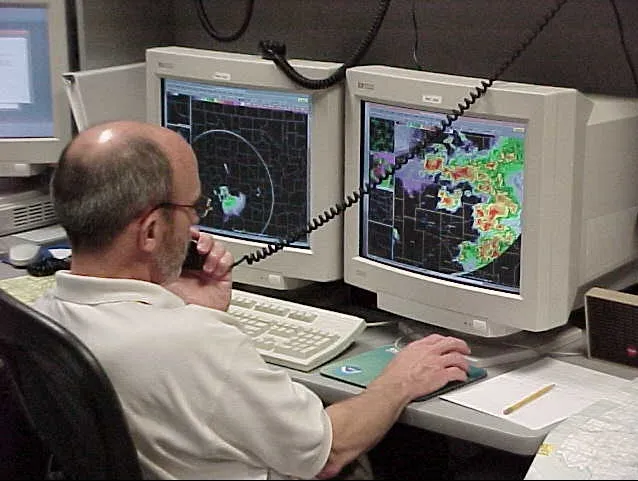
The final and arguably most important tool forecasters use is the “analog year” method, comparing this year’s combination of ENSO status, sea ice levels, QBO phase, and jet stream behavior to historical years with a similar setup. No single signal ever tells the full story, but matching multiple indicators to past winters gives forecasters their strongest confidence level of the entire process.
This is why professional seasonal outlooks often reference specific past winters by name, like a doctor comparing your symptoms to a known case file. If six or seven indicators all point toward the same handful of historical analogs, that’s when a forecaster will finally commit to language like “colder and snowier than average” instead of hedging with vague uncertainty.
It’s far less glamorous than a groundhog crawling out of a burrow, but it’s the actual method behind every serious winter outlook you’ll see published this year.
The Bottom Line
🔥 Would you like to save this?
We'll email this post to you, so you can come back to it later!
Winter forecasting isn’t guesswork. It’s a seventeen-point puzzle built from ocean temperatures, stratospheric winds, and ice data collected months before the first flake ever falls. And here’s the part that should honestly bother people more than it does: most of these signals are public right now, sitting on government websites, while folklore predictions with zero scientific backing rack up millions of shares instead.
Forecasters aren’t reading tea leaves or wooly worm stripes. They’re reading satellites, buoys, and eighty years of historical analogs, cross-checking one signal against another until a real pattern emerges. If you take one thing from this list, let it be this: the real winter forecast started in September. Most people just never knew where to look.
Which of these seventeen signals surprised you the most? Drop your own prediction for this winter in the comments.

- 14 Wildlife Permits Waived for Americans the Year They Turn 62 - November 5, 2026
- Machu Picchu’s Engineering Feats Were Far Ahead of Its Time - November 5, 2026
- 12 Most Beautiful American Cities To See Before You Die - November 4, 2026