

If you put ten otherwise similar Americans in ten different cities, their odds of reaching 75 can swing wildly. That’s not just about personal choices—it’s about stacked city‑level risks: air you breathe, heat you endure, streets you cross, rent you pay, clinics you can’t reach, and violence or overdose you can’t always avoid. This report pinpoints 40 U.S. cities where overlapping hazards make it harder to live a long, healthy life in 2025, then lays out what’s driving the risk—and what would actually help.
Read this like a risk map. Each city section includes: the big reasons life expectancy gets cut short; a quick stat snapshot from the last 1–2 years; pocketbook pressures that magnify health risk; and evidence‑based actions that bend the curve.
How We Chose These Cities (Methods in Brief)
We synthesized the most recent national and local public‑health, environment, injury, and cost‑burden datasets released in 2024–2025. Indicators emphasized include violent‑injury and overdose mortality; cardiometabolic disease drivers (obesity, diabetes, smoking); air pollution (PM2.5/ozone); extreme‑heat exposure; traffic fatalities; housing and energy cost burdens; food access; and health‑care coverage and access. Where city‑level numbers are limited, we used county or metro indicators that best reflect resident exposure. (See Sources & Methods at the end.)
National Context You Should Know (2023–2025)
- Air quality: 2025 air‑quality rankings show tens of millions still breathing unhealthy ozone and PM2.5, with California’s Central Valley and Southern California at the top of the risk tables.
- Heat: 2023 likely set a modern record for heat‑related mortality, and 2024 was the warmest U.S. year on record, lengthening “summer” and compounding heart/lung stress, especially in low‑tree‑canopy neighborhoods.
- Injury & overdose: Homicide levels fell in many cities in 2024, but remain elevated in specific corridors; synthetic‑opioid (fentanyl) deaths are still a leading driver of premature mortality, with some large cities showing improvement since 2023 while others remain historically high.
- Traffic: U.S. traffic deaths declined in 2023 and early 2024, but remain above pre‑pandemic levels, with pedestrian risk still severe on high‑speed arterials.
- Costs: Rent and utility burdens hit record highs for renters in 2023–2024; uninsured rates remain highest in several Sun Belt states, limiting preventive care and heat protection.
- Bottom line: The same neighborhoods facing the heaviest heat, air, and cost burdens are often the ones with the highest injury and chronic‑disease risk. That is where life expectancy erodes fastest.
#23 Memphis, Tennessee
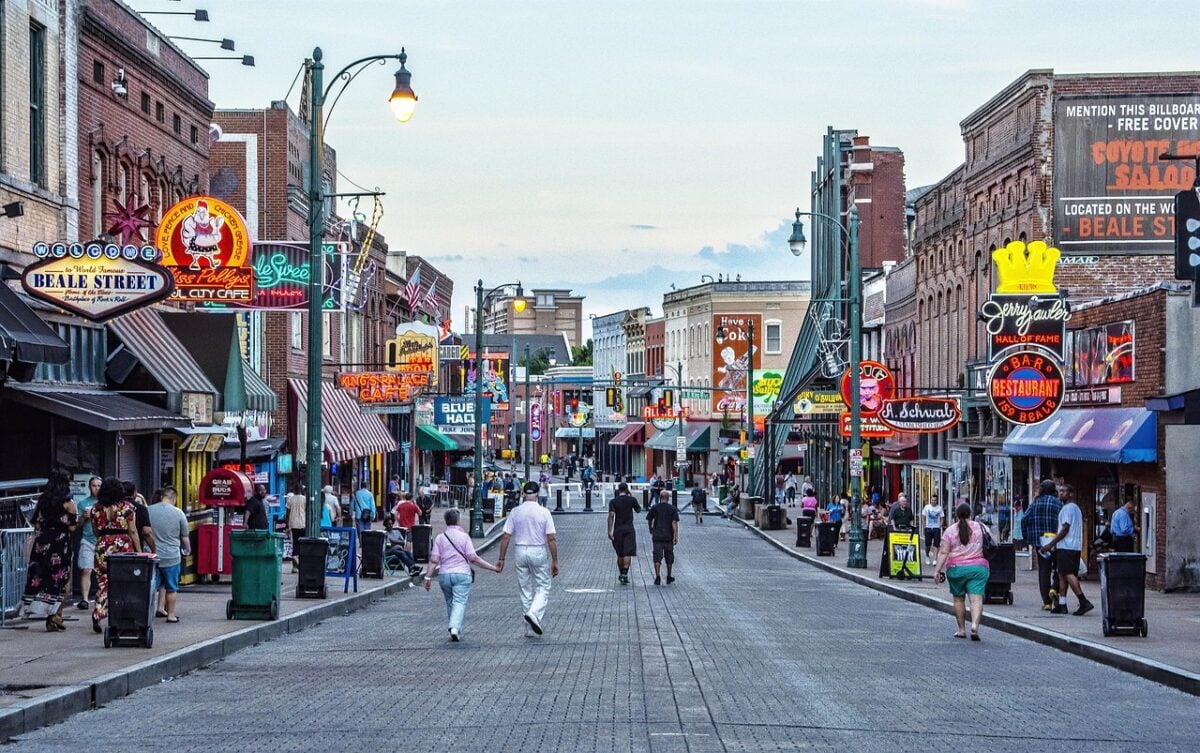
Memphis has long been a city of deep cultural roots and community pride, but it is also a place where poverty and public‑safety concerns cut lives short. Residents face elevated risks from gun violence, diet‑related chronic illnesses, and increasingly severe summer heat. High energy bills and limited access to affordable healthcare magnify these challenges. Without urgent reforms, the city’s health divide will remain one of the widest in the country.
Why life expectancy suffers
- Concentrated violent‑injury risk, high poverty, chronic‑disease burden (hypertension/obesity), and severe summer heat.
- Recent signals (2023–2025)
- Homicides fell from pandemic‑era highs into 2024, but remain a serious health burden.
- Ozone/heat days stress cardiopulmonary health.
- Cost & access pressures
- High energy and rent burdens; food‑access gaps in South/North Memphis.
What would help
Focused deterrence + hospital‑based violence intervention; BP/diabetes control in neighborhood clinics; shade/cooling expansion; produce incentives at corner stores.
#22 St. Louis, Missouri
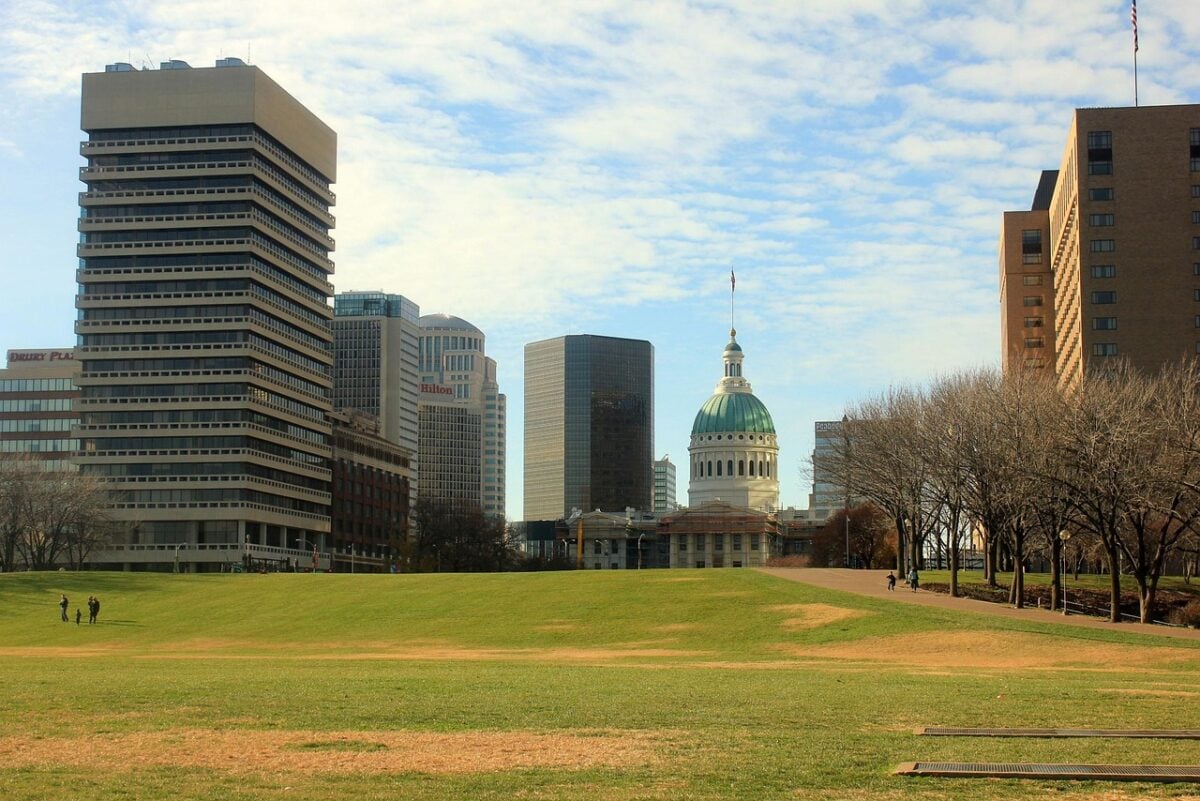
St. Louis tells a story of legacy industry, urban decline, and neighborhoods marked by sharp disparities. Residents in certain tracts live decades less than wealthier neighbors just miles away. Air quality, chronic disease, and lingering violent crime take a heavy toll. Although homicide has improved in recent years, the city still struggles with preventable deaths linked to poverty and environment.
Why life expectancy suffers
Hot‑spot violence, legacy disinvestment, cardiometabolic disease, and pollution spikes.
Recent signals
- Homicide rates eased from 2020–2022 peaks but remain elevated.
- Wildfire smoke and ozone up the respiratory load.
- Cost & access pressures
- Aging homes amplify heat/cold stress; rent and utility burdens high.
- Uneven access to primary and behavioral health.
- What would help
- Gun‑violence prevention; lead‑safe/energy‑efficient rehabs; COPD/asthma management.
#21 New Orleans, Louisiana
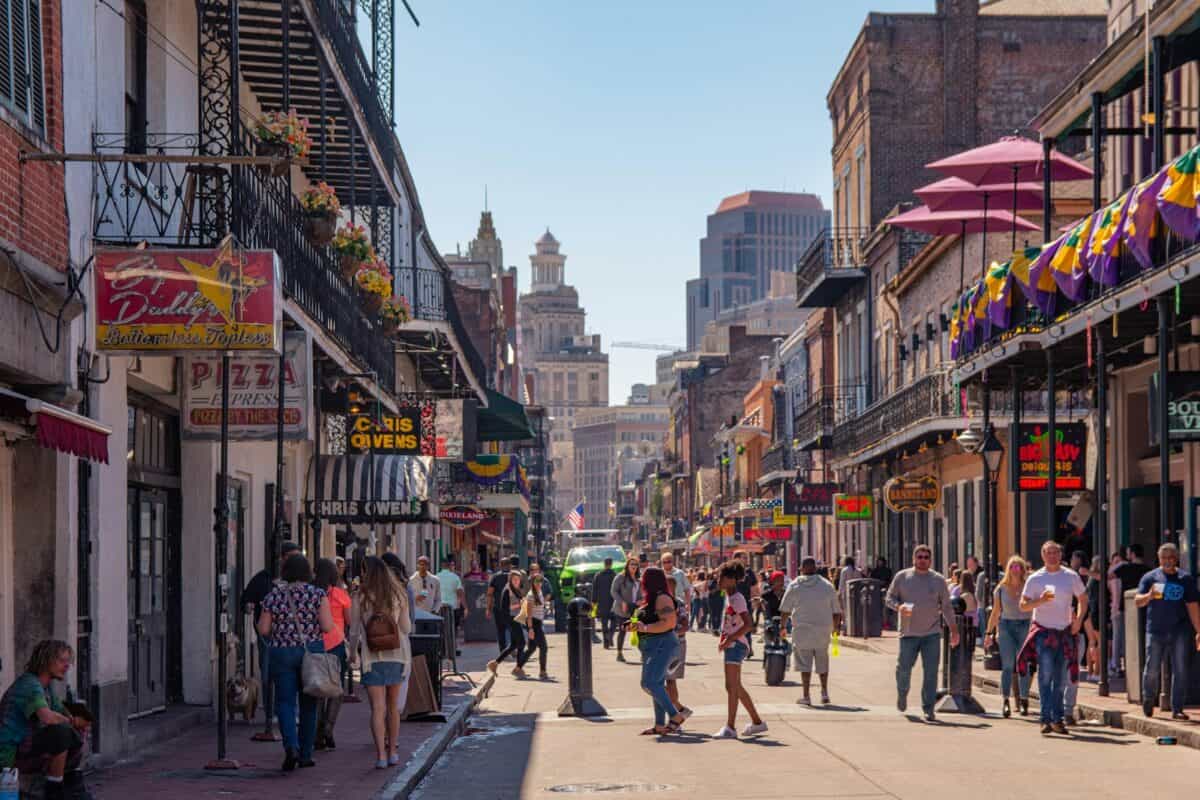
New Orleans is celebrated worldwide for its music and food, yet residents often face harsh health realities. Hurricanes, flooding, and mold leave behind chronic respiratory issues, while high rates of diabetes and hypertension chip away at longevity. Persistent crime and poverty deepen the city’s life‑expectancy challenges. For many families, rebuilding after disaster is a recurring strain that undermines long‑term health.
Why life expectancy suffers
- Injury risk, diabetes/hypertension, hurricane/flood and extreme‑heat exposure; mold worsens asthma.
- Recent signals
- Homicide rates trended down in 2024 but remain a mortality driver.
- More frequent ozone/heat alerts.
- Cost & access pressures
- Insurance/repair costs, flood recovery; transportation and food‑access gaps.
What would help
Community violence interruption; resilient cooling and backup power; flood mitigation and post‑storm mold abatement; diabetes/HTN outreach.
#20 Baltimore, Maryland
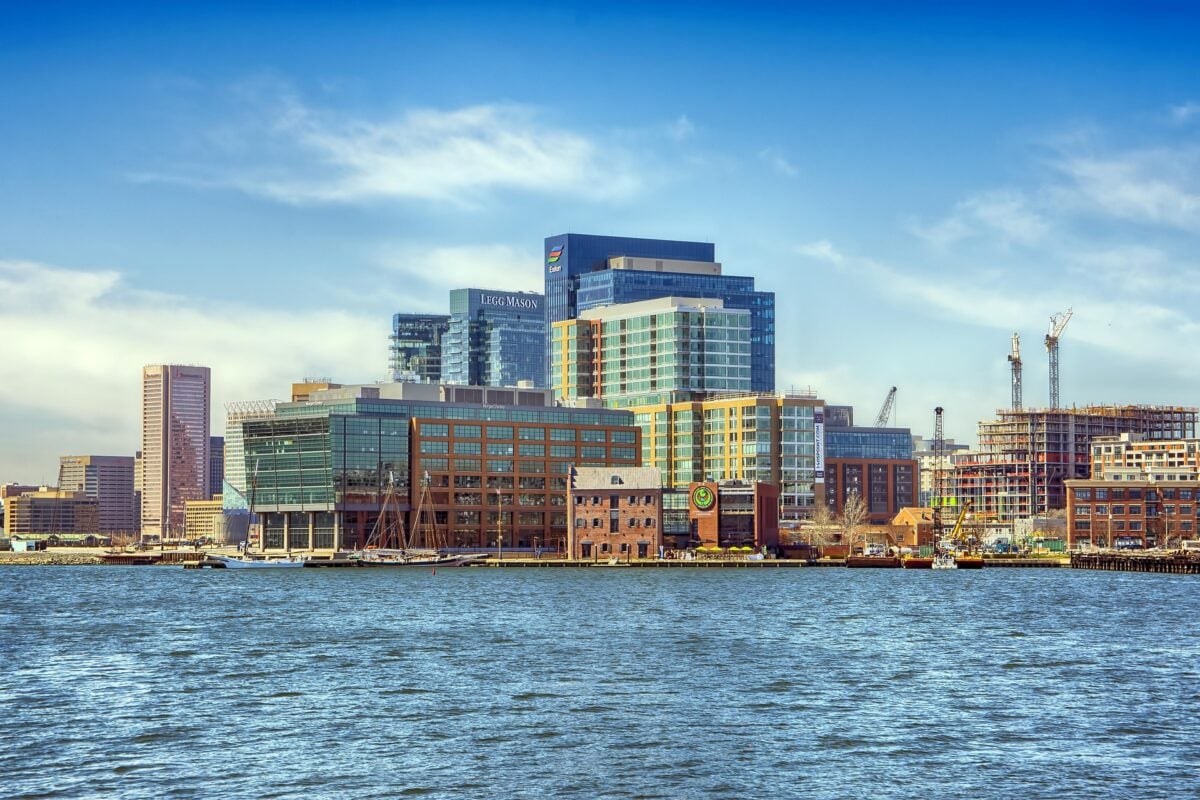
Baltimore is a city of resilience but also of stark inequities. Decades of concentrated poverty and disinvestment leave many neighborhoods plagued by violence and overdoses. Children in older housing suffer disproportionately from asthma and poor air quality. Despite progress in lowering homicides in 2024, health gaps remain severe. Access to healthcare and addiction services is often inconsistent across the city.
Why life expectancy suffers
Concentrated violence and overdose mortality, plus asthma/COPD burdens and stark neighborhood inequities.
Recent signals
- 201 homicides in 2024 (lowest in a decade+) after focused deterrence.
- Fentanyl remains a leading cause of midlife death.
- Cost & access pressures
- Rent/transport burdens; pediatric asthma hot spots in older housing near traffic.
What would help
Group Violence Reduction + hospital‑based programs; MOUD (methadone/buprenorphine) access and wound‑care for xylazine; home remediation for asthma.
#19 Detroit, Michigan
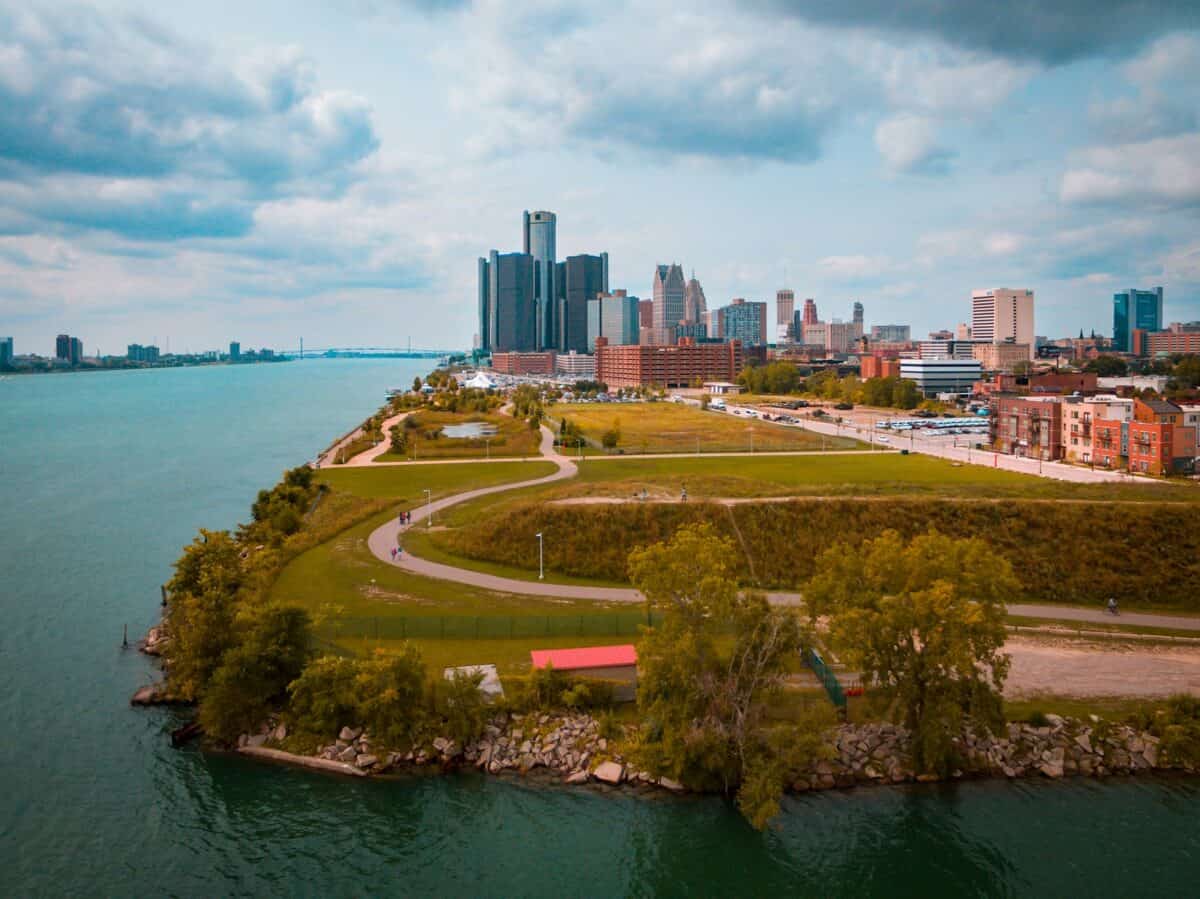
Detroit’s renaissance narrative often overshadows the day‑to‑day health burdens faced by many residents. Air pollution remains among the worst in the country, exacerbating heart and lung disease. Traffic injury, economic hardship, and high utility costs layer additional risks. While downtown redevelopment tells one story, poorer neighborhoods face limited healthcare access and persistent chronic‑disease challenges.
Why life expectancy suffers
Chronic disease and injury risks intersect with PM2.5 exposure and winter hazards.
Recent signals
- Detroit metro ranks among the nation’s worst for year‑round PM2.5.
- Traffic injury remains elevated on high‑speed corridors.
- Cost & access pressures
- Heavy energy burden in older homes; car‑dependence raises costs and risk.
What would help
Truck/transit electrification; HTN/diabetes clinics; large‑scale weatherization.
#18 Cleveland, Ohio
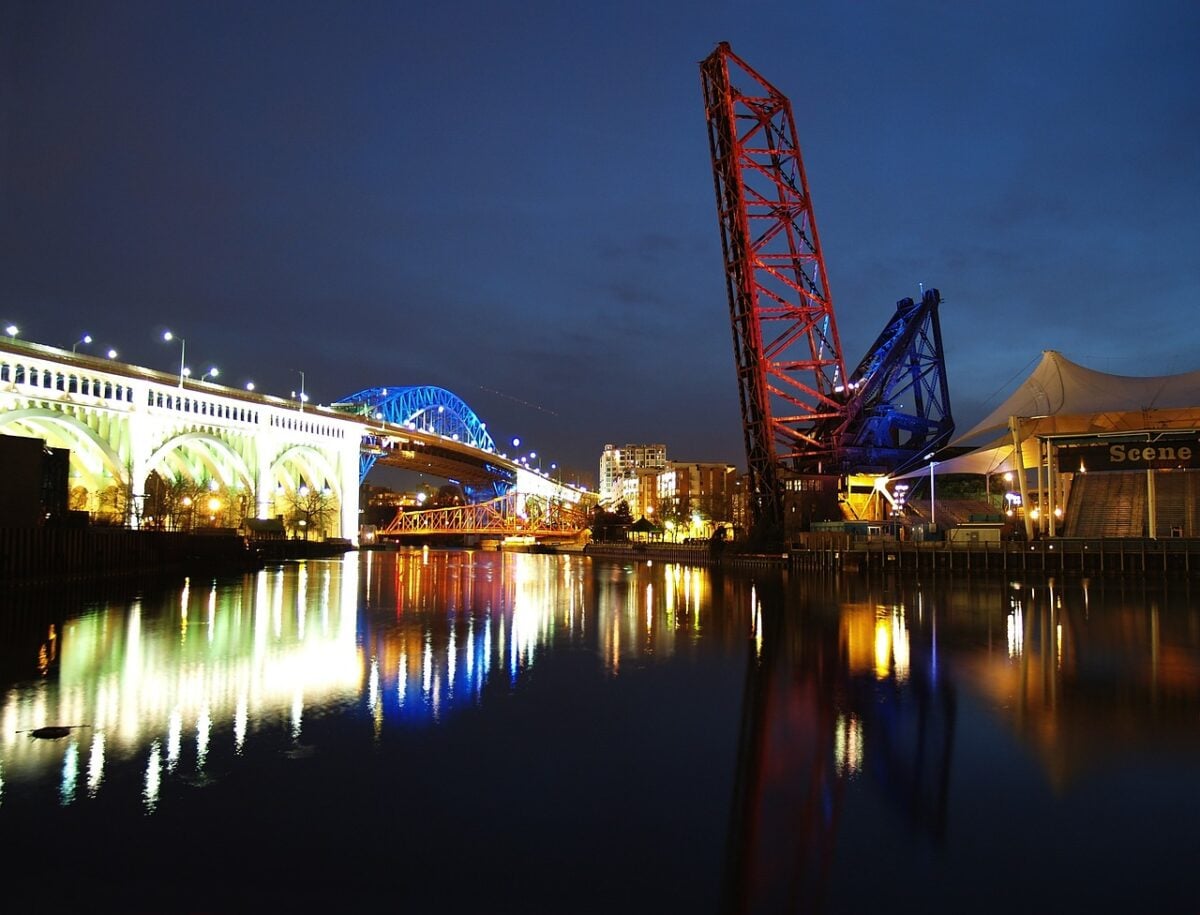
Cleveland combines a proud industrial past with current struggles in public health. Opioid overdoses and elevated obesity rates shorten lives in many neighborhoods. Winters bring harsh spikes in respiratory and cardiac events, while smoke and air pollution intensify risks. Food deserts and a lack of accessible primary care keep residents trapped in cycles of preventable illness.
Why life expectancy suffers
Cardiometabolic disease, overdose mortality, winter/air‑pollution stress.
Recent signals
- Cleveland–Akron among top 10 for annual PM2.5 nationally.
- Opioid mortality remains a midlife killer.
- Cost & access pressures
- Heat/cold utility costs; food‑access gaps; primary‑care deserts.
What would help
Asthma/COPD control, MOUD integration in primary care, lead‑safe enforcement.
#17 Milwaukee, Wisconsin
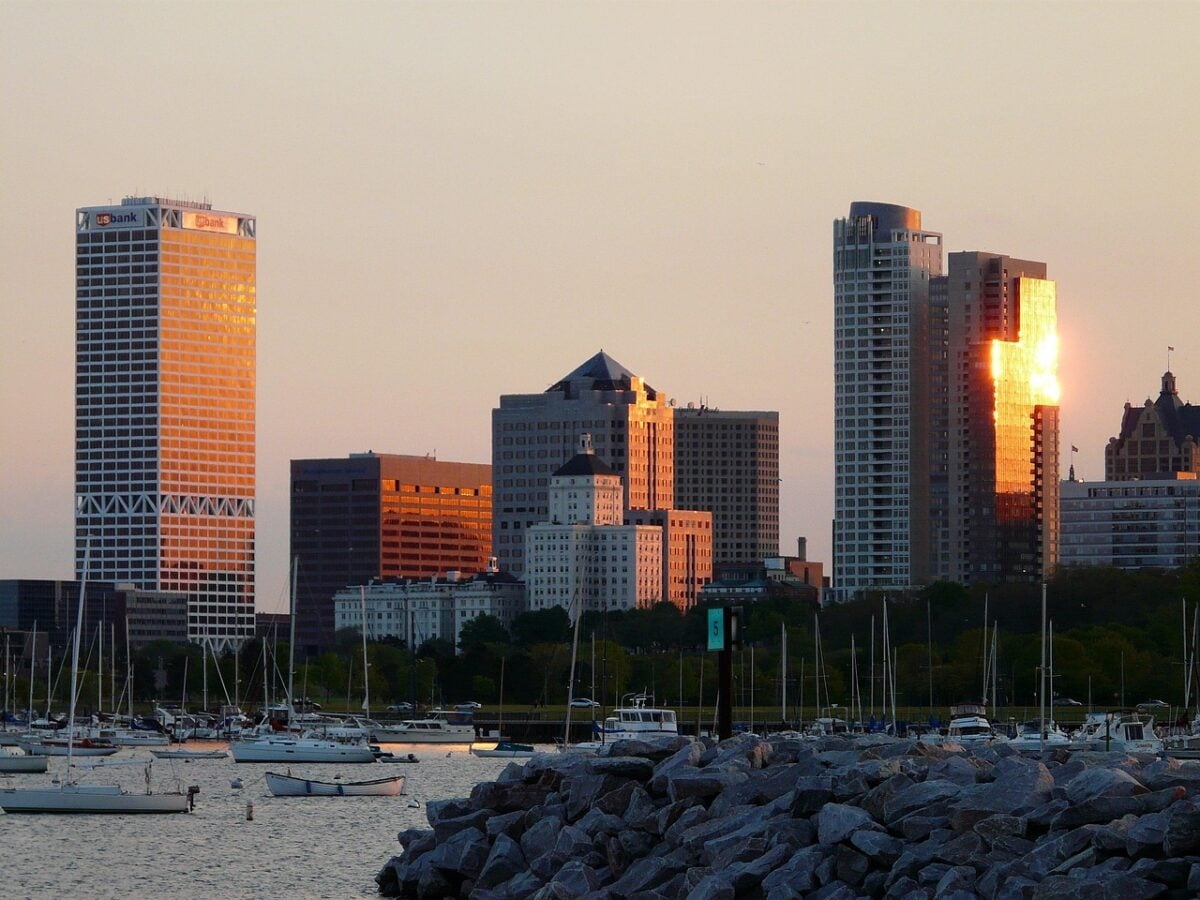
Milwaukee’s lakeside beauty contrasts with the wide health divide across its neighborhoods. Infant and maternal mortality disparities are some of the worst in the country. Ozone spikes from summer smog and regional wildfire smoke add pressure on already fragile health systems. Rent burdens and heating costs cut into money that could otherwise go to healthier living. The result is one of the nation’s sharpest life‑expectancy gaps.
Why life expectancy suffers
Large tract‑to‑tract gaps in injury, chronic disease, and infant/maternal outcomes.
Recent signals
- Wildfire smoke spikes and ozone events increased.
- Persistent disparities in cardiovascular and maternal health.
- Cost & access pressures
- Rising rent and winter heating burdens; pockets of low food access.
What would help
Cardiovascular risk management; maternal/infant health initiatives; smoke‑ready shelters; anti‑violence efforts.
#16 Philadelphia, Pennsylvania
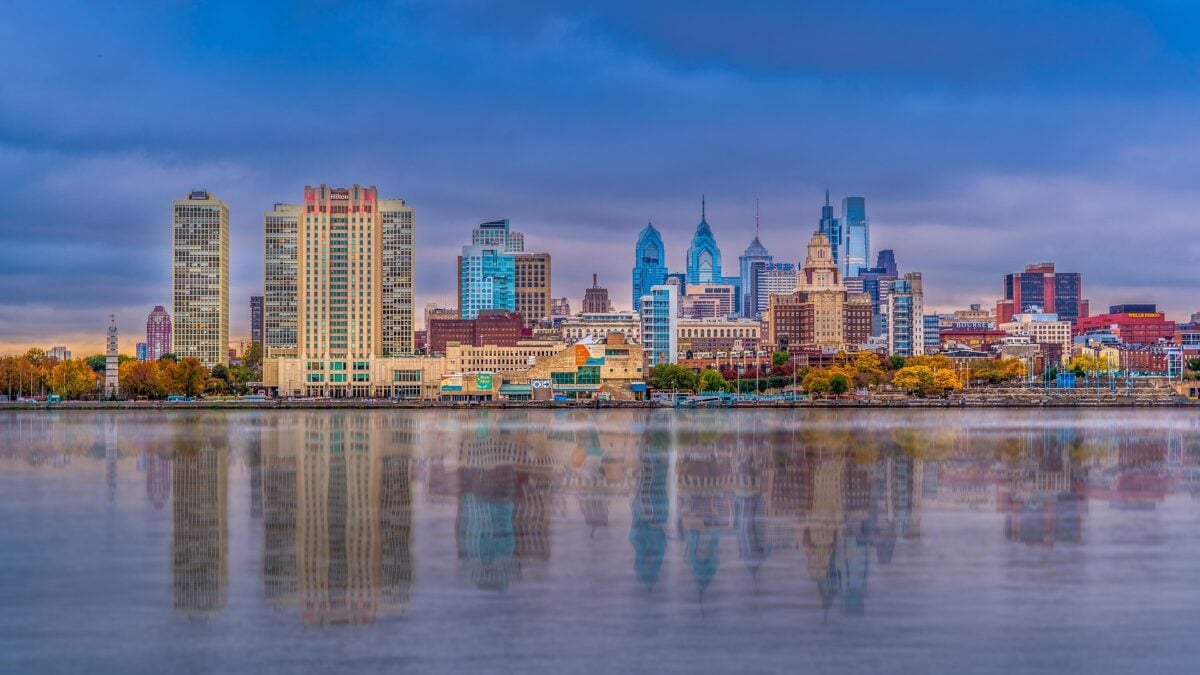
Philadelphia is rich in history and culture, yet it faces a devastating epidemic of fentanyl overdoses. Gun violence compounds the crisis, leaving many neighborhoods traumatized. Air‑quality problems add to the respiratory strain in poorer areas. With poverty and housing instability high, life expectancy in Philadelphia can drop significantly depending on where you live.
Why life expectancy suffers
Drug overdose mortality, firearm injury, and high poverty rates shorten healthy lives.
Recent signals
- Overdose deaths fell ~7% in 2023 with further decline indicated in 2024, but totals remain historically high.
- 2023 smoke episodes worsened air days.
- Cost & access pressures
- Rent and medical debt; transit costs; food/environmental burdens in North/West Philly.
What would help
MOUD scale‑up; xylazine wound care; violence intervention; asthma management + green corridors.
#15 Washington, DC
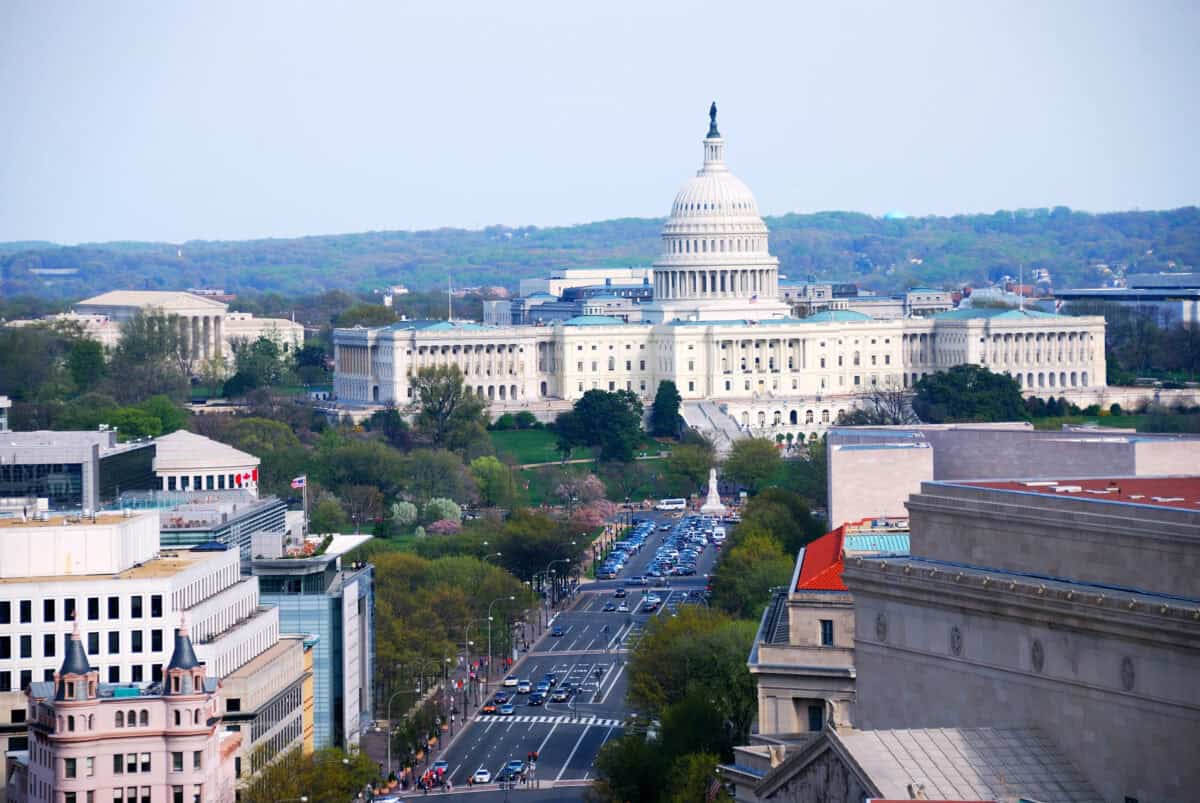
The nation’s capital showcases wealth and power, but its neighborhoods tell another story. Life expectancy can swing more than 20 years between wards. After a deadly surge in homicides in 2023, violence remains a critical health concern even with improvements in 2024. Extreme summer heat and poor‑air days create added strain, especially for low‑income families priced out of cooler, greener spaces.
Why life expectancy suffers
Surge in homicides in 2023, heat stress, massive neighborhood gaps in life expectancy.
Recent signals
- 274 homicides in 2023; 2024 homicides fell to 187 (−32%), but trauma and risk persist.
- Hotter summers and poor‑air days intensify cardiopulmonary risk.
- Cost & access pressures
- High housing and insurance costs; displacement pressures.
What would help
Ward‑specific violence prevention; urban‑heat resilience; COPD/asthma supports; targeted rent relief.
#14 Chicago, Illinois

Chicago is often celebrated as a cultural hub of the Midwest, but beneath its iconic skyline lies a public health crisis that continues to shorten lifespans. The city faces persistent challenges with gun violence, air pollution, and unequal access to healthcare, all of which contribute to higher-than-average mortality rates. Food insecurity in several neighborhoods, coupled with stressors linked to poverty, also play a significant role in limiting quality of life. While Chicago boasts world-class hospitals, access to consistent medical care is uneven, leaving many residents vulnerable to chronic diseases that could otherwise be prevented or better managed.
Why life expectancy suffers
Segregated exposure to firearm injury and chronic disease; ozone/PM spikes; winter exposure; traffic injury.
Recent signals
- Homicides declined from pandemic highs but remain among the nation’s largest totals.
- 2023 wildfire smoke produced multiple “unhealthy” days.
- Cost & access pressures
- Rent/heating burdens; food access gaps on South/West Sides.
What would help
Sustained violence‑reduction; neighborhood clinics; smoke/heat preparedness.
#13 Birmingham, Alabama
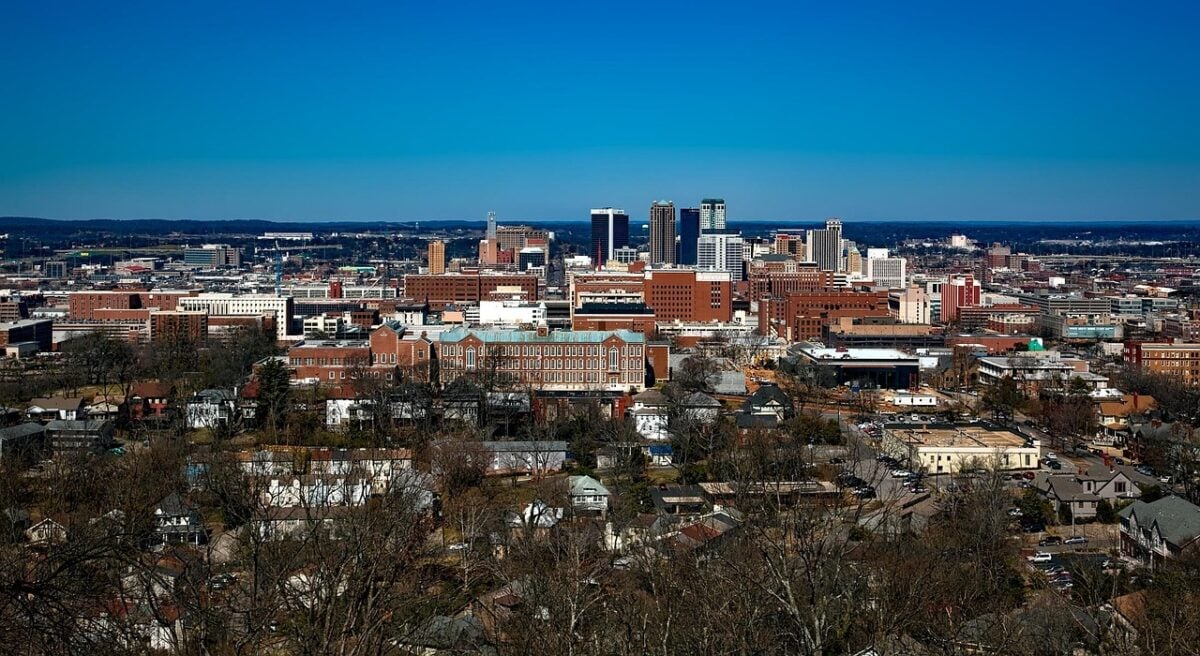
In Birmingham, the challenges are equally pressing, though the causes differ. Known historically as an industrial city, Birmingham grapples with obesity, heat-related health risks, and injury rates that significantly impact longevity. Many residents face limited access to fresh, healthy foods, creating a cycle of poor nutrition and chronic disease. Add to this the rising impact of extreme Southern summers, which increase heat stress and exacerbate respiratory and cardiovascular conditions, and the picture becomes even more concerning. Despite ongoing efforts to improve healthcare infrastructure, Birmingham continues to rank among U.S. cities where residents face the greatest risks of dying younger than the national average
Why life expectancy suffers
Top‑tier obesity/smoking prevalence, heat/humidity, and injury risk.
Recent signals
- Alabama remains among the highest in adult obesity and cardiovascular mortality.
- More frequent ozone/heat alerts.
- Cost & access pressures
- Energy burden in older housing; transportation costs; food‑access gaps.
What would help
BP/diabetes control; cooling centers/weatherization; high‑injury street redesigns.
#12 Jackson, Mississippi
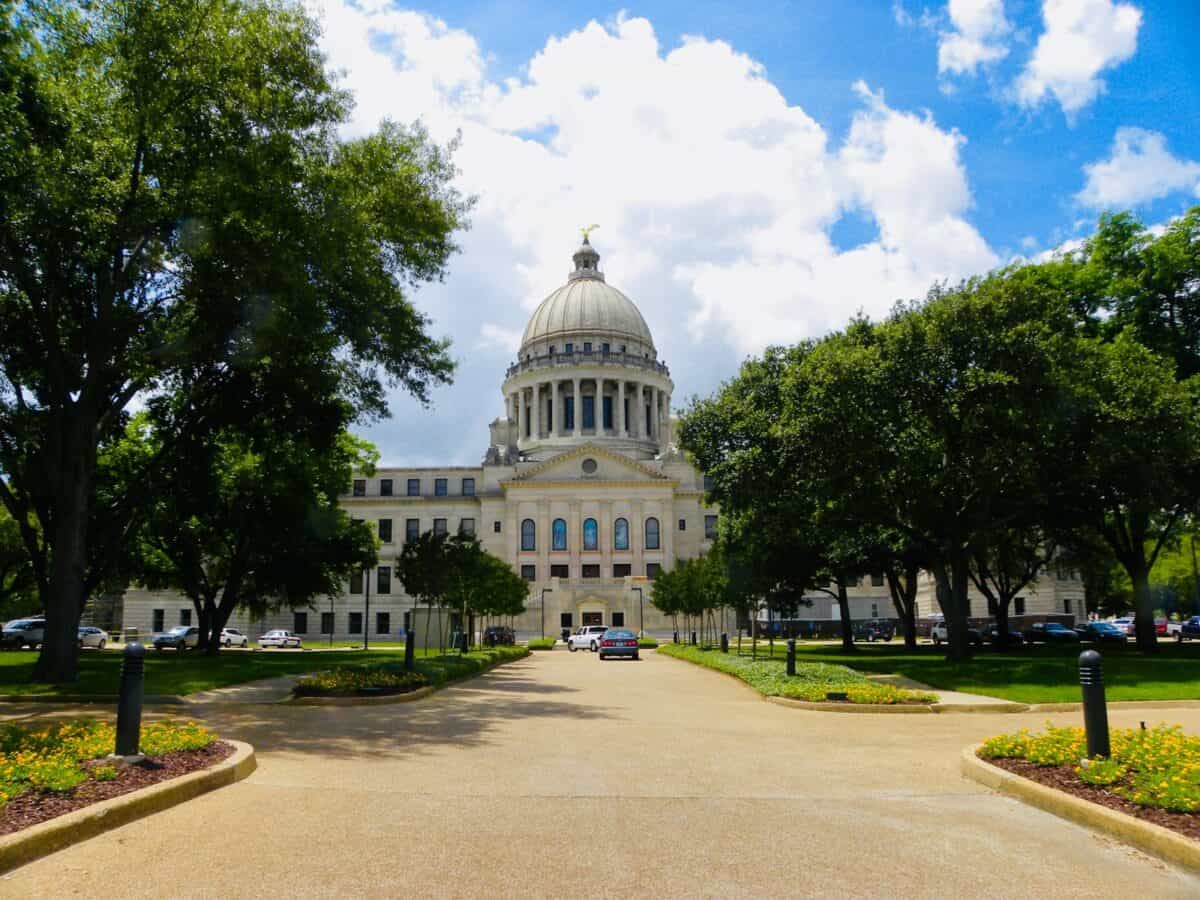
Jackson is a city grappling with infrastructure breakdowns that directly affect health. Residents face recurring water crises, boil‑water notices, and high chronic‑disease rates. Heat waves further threaten vulnerable groups who struggle with utility bills. For many families, basic needs like safe water and affordable healthcare are not guaranteed.
Why life expectancy suffers
Water‑infrastructure failures, cardiometabolic disease, and rising heat.
Recent signals
- State‑leading obesity and heart‑disease mortality; recurring boil‑water notices.
- Intense heat waves and humidity.
- Cost & access pressures
- High poverty; rent/utility burdens; transit barriers to care.
What would help
Safe‑water investment; HTN/diabetes outreach; heat‑resilience network.
#11 Baton Rouge, Louisiana
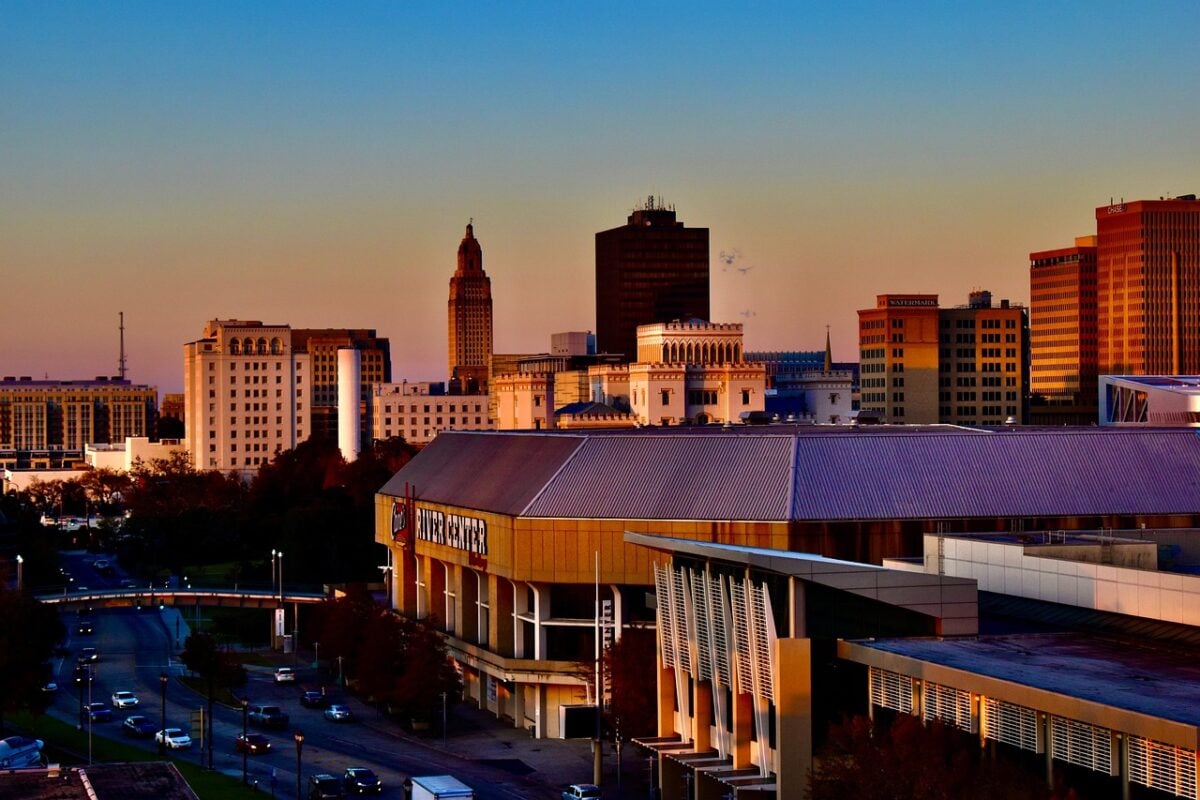
Baton Rouge sits at the center of Louisiana’s petrochemical corridor, exposing residents to industrial emissions alongside heat stress. Chronic disease, violence, and addiction weigh heavily on life expectancy. Insurance and housing costs remain high for many households. The city’s health outlook is deeply intertwined with environmental and economic pressures.
Why life expectancy suffers
Violent injury risk, petrochemical‑corridor air exposures, extreme heat.
Recent signals
- Ozone days and heat intensify cardiopulmonary risk.
- Injury/overdose drive midlife mortality.
- Cost & access pressures
- Rent and insurance burdens, uneven food access.
What would help
Violence reduction; emissions controls; neighborhood clinics.
#10 Oakland, California
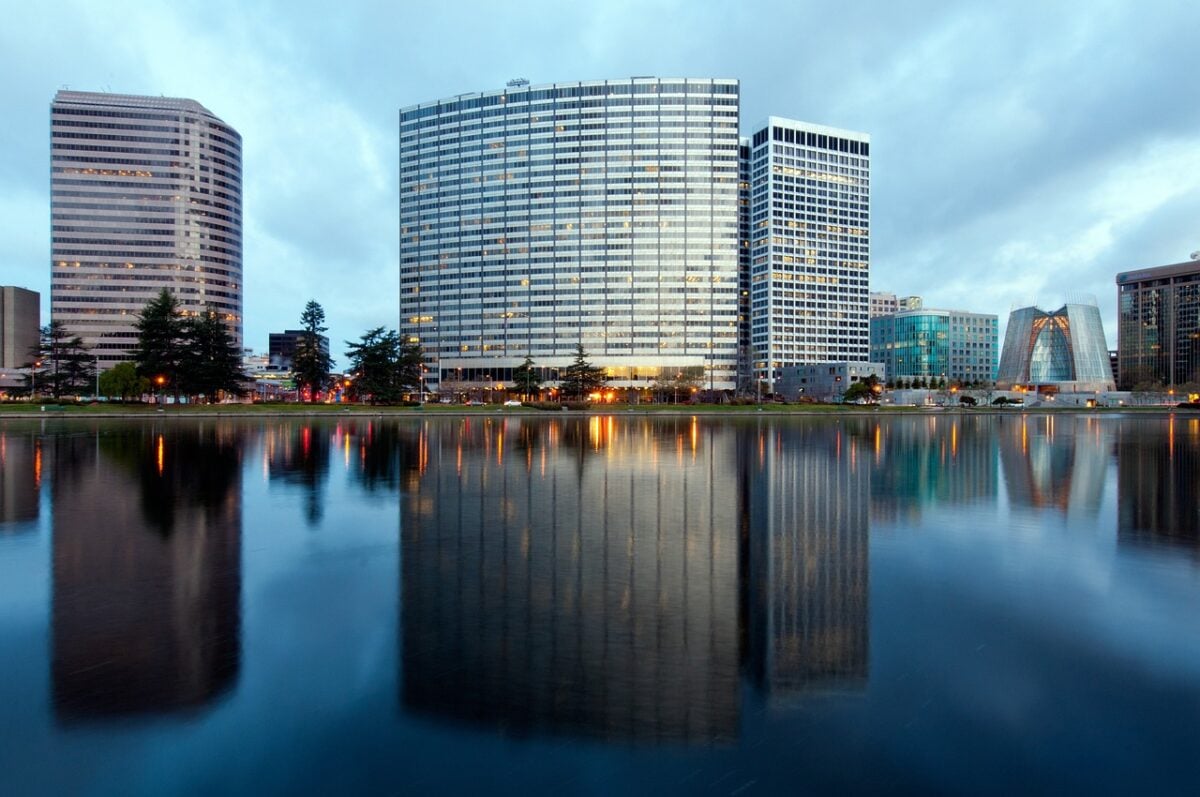
Oakland combines cultural diversity with stark inequality. Families in East Oakland face displacement pressures, high housing costs, and poor air quality. Violence and traffic injuries remain concentrated in specific corridors. Wildfire smoke events regularly worsen health conditions, adding another layer of strain.
Why life expectancy suffers
Injury risk in certain corridors, extreme rent burdens, and smoke/ozone events.
Recent signals
- Bay Area ranks among top metros for annual PM2.5; wildfires drive acute spikes.
- Traffic injury disproportionately affects low‑income neighborhoods.
- Cost & access pressures
- Extreme rent/insurance costs; food‑access gaps in East Oakland.
What would help
Traffic calming; smoke‑ready shelters/filtration; anti‑displacement + clinic access.
#9 San Bernardino, California
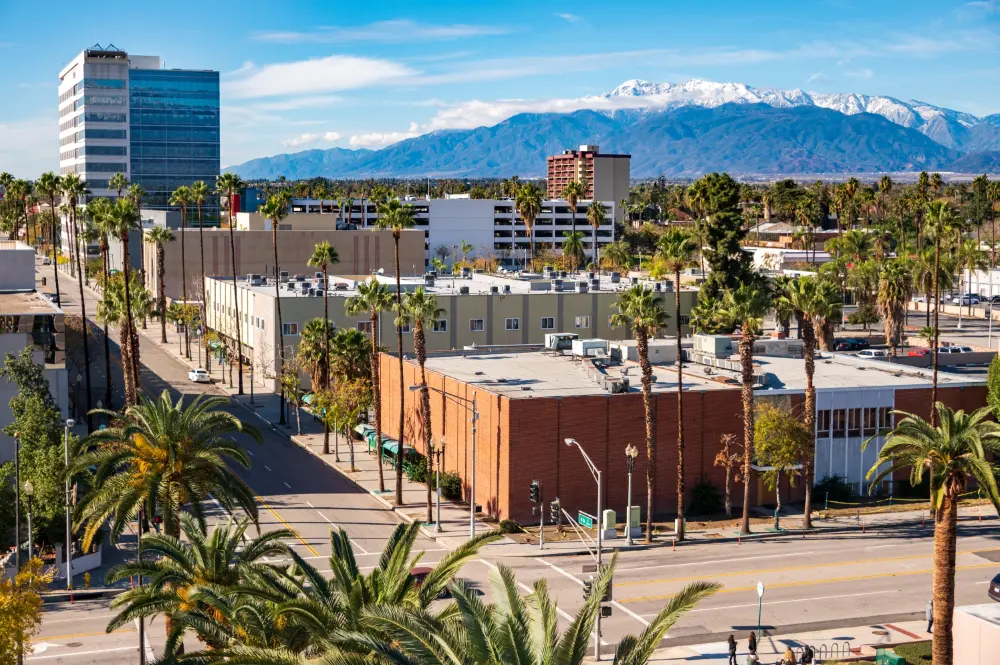
San Bernardino lies at the heart of the nation’s worst ozone corridor. Residents experience high air pollution, extreme heat, and economic stress. Truck traffic adds particulate matter that worsens asthma and heart disease. Rent burdens and limited shade infrastructure leave many without relief from rising risks.
Why life expectancy suffers
Worst‑in‑nation ozone corridor, persistent PM exposure, heat extremes.
Recent signals
- Inland Empire repeatedly ranks #1–2 for ozone; PM adds cardiometabolic risk.
- Heat days and warehouse‑truck traffic amplify exposure.
- Cost & access pressures
- Rent/commuting costs; limited shade; asthma burdens for traffic‑adjacent schools.
What would help
Zero‑emission freight; greening/shade; school‑based asthma programs.
#8 Stockton, California
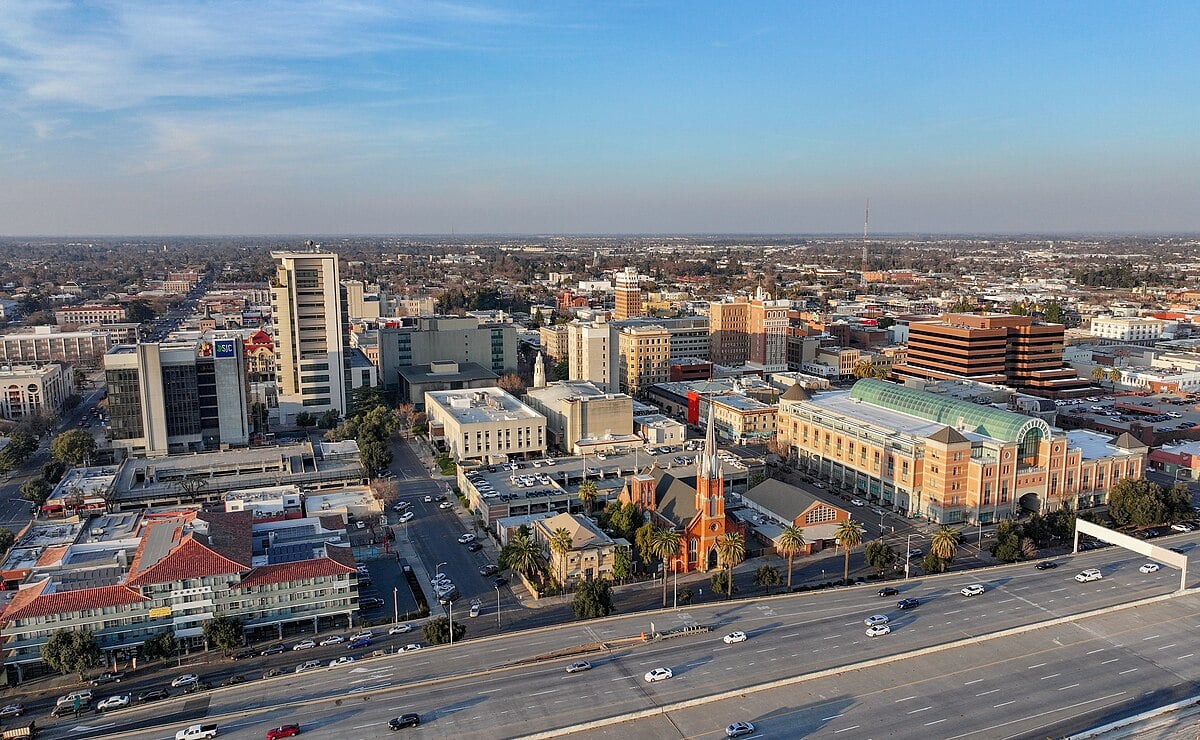
Stockton is marked by both agricultural richness and significant health risks. Ozone and particulate matter exposure is severe, while extreme heat has become a seasonal norm. Many families struggle with rising rents and high cooling costs. Violence and uneven healthcare access deepen the city’s challenges.
Why life expectancy suffers
Ozone/PM exposure, heat, economic stress, and injury risk.
Recent signals
- Central Valley metros are among the worst for PM2.5 and ozone.
- Heat and smoke peak late summer.
- Cost & access pressures
- Rising rent; high cooling costs; uneven access to care.
What would help
Tree canopy + cool pavement; clinic expansion; violence‑reduction programs.
#7 Fresno, California
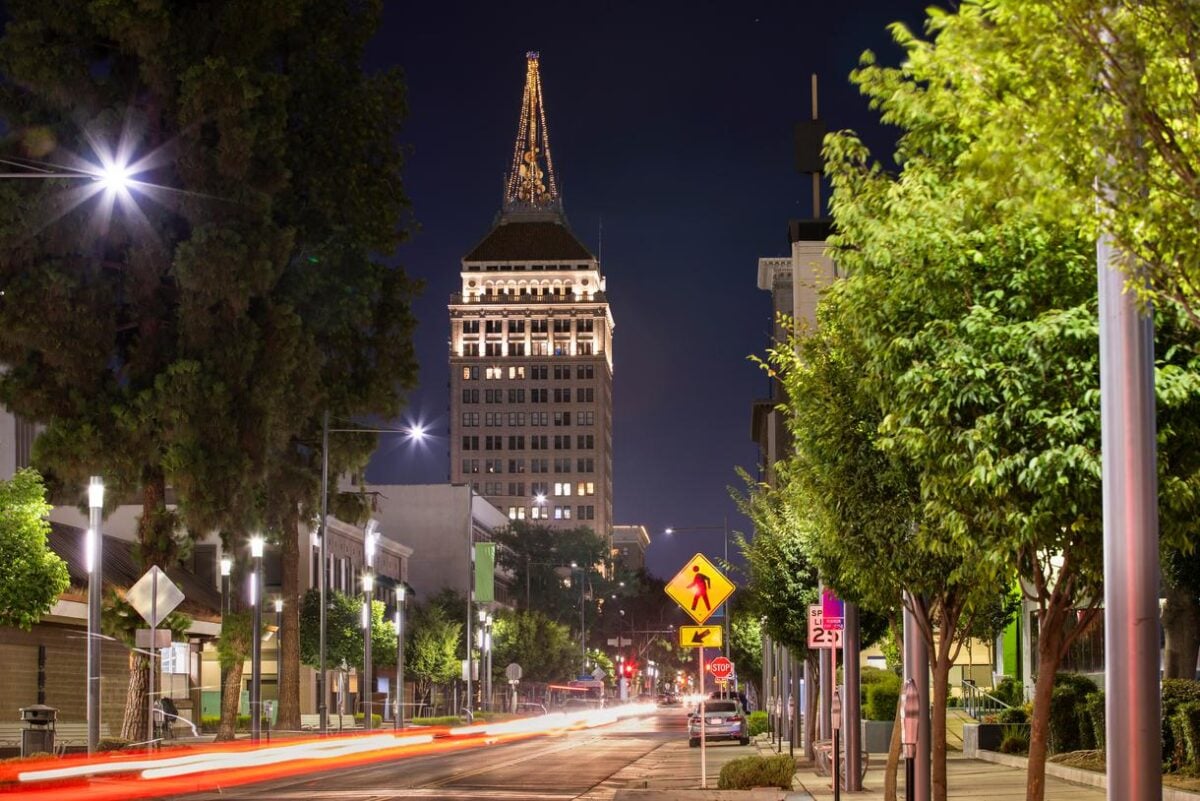
Fresno faces some of the worst air pollution in the country. Particulate matter and ozone levels repeatedly rank near the top nationwide. Combined with extreme heat and high poverty, these exposures shorten lives. Agricultural laborers and children suffer disproportionately from asthma and other chronic conditions.
Why life expectancy suffers
Among the nation’s worst PM2.5 and ozone exposures, plus extreme heat and poverty.
Recent signals
- Fresno–Hanford ranks top‑5 for both PM2.5 categories and top‑5 for ozone.
- Heat‑related ER visits spike during multi‑day heat waves.
- Cost & access pressures
- Cooling/energy burdens; outdoor agricultural work exposure; care access varies.
What would help
Filtration distribution; emissions controls; heat protections for outdoor workers.
#6 Bakersfield, California

Bakersfield is consistently ranked America’s worst city for air quality. Residents face top‑tier PM2.5 and ozone exposure year‑round. Extreme heat and economic hardship magnify the strain on vulnerable households. Pediatric asthma remains one of the most visible health consequences of poor air conditions.
Why life expectancy suffers
#1 for annual and short‑term PM2.5 and top‑tier ozone; extreme heat; economic stress.
Recent signals
- Bakersfield–Delano consistently ranks #1 for year‑round PM2.5 and #1 for short‑term PM2.5; top‑3 for ozone.
- Frequent “unhealthy” air days during heat/smoke.
- Cost & access pressures
- High cooling costs for low‑income renters; outdoor work exposure common.
What would help
Aggressive PM controls; filtration; shade/cooling access; asthma control.
What would help
Dust/PM controls; heat standards for farm workers; filtration for homes/schools.
#5 Houston, Texas
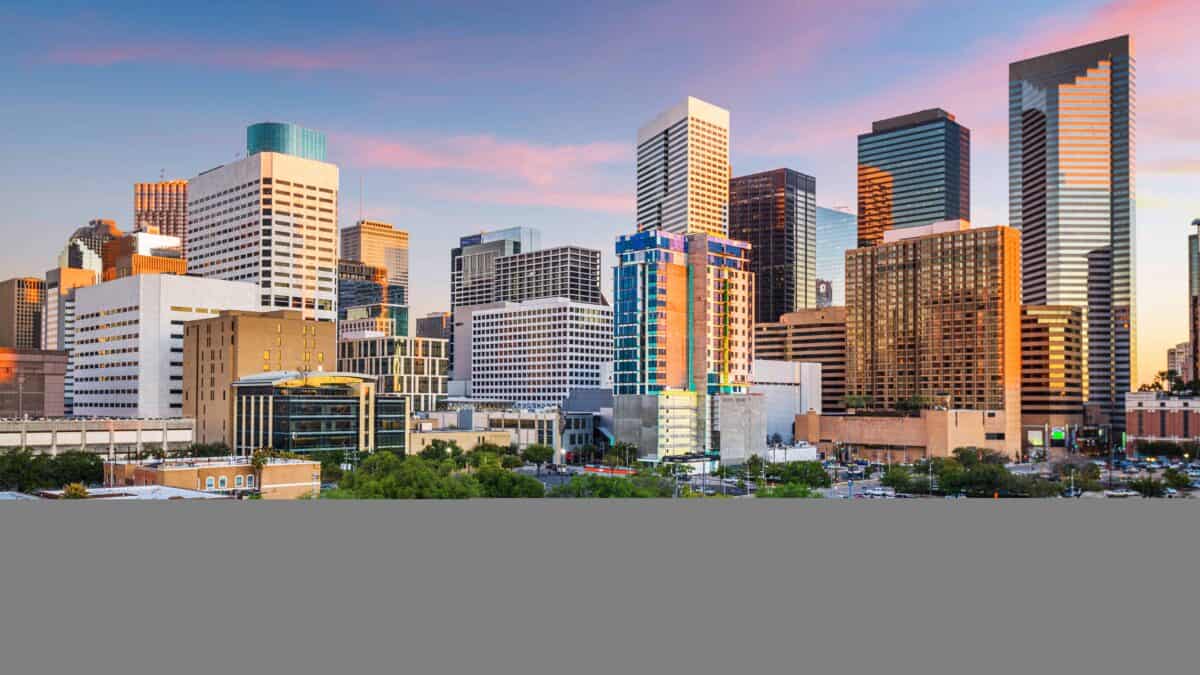
Houston is America’s energy capital but also a hotspot for public‑health concerns. Residents endure high ozone exposure, petrochemical emissions, and repeated flood‑mold cycles. Extreme heat and humidity create further health stress. High insurance and medical costs leave many uninsured and vulnerable.
Why life expectancy suffers
High ozone, petrochemical exposures, extreme heat/humidity, traffic injury, and flood‑mold cycles.
Recent signals
Houston–Pasadena ranks top‑10 for ozone; dangerous heat and humidity days are climbing.
Post‑flood mold spikes asthma.
Cost & access pressures
High insurance and energy costs; state‑high uninsured rates limit preventive care.
What would help
Ozone‑precursor cuts; flood‑resilient retrofits; Medicaid enrollment help; safer streets.
#4 Dallas, Texas
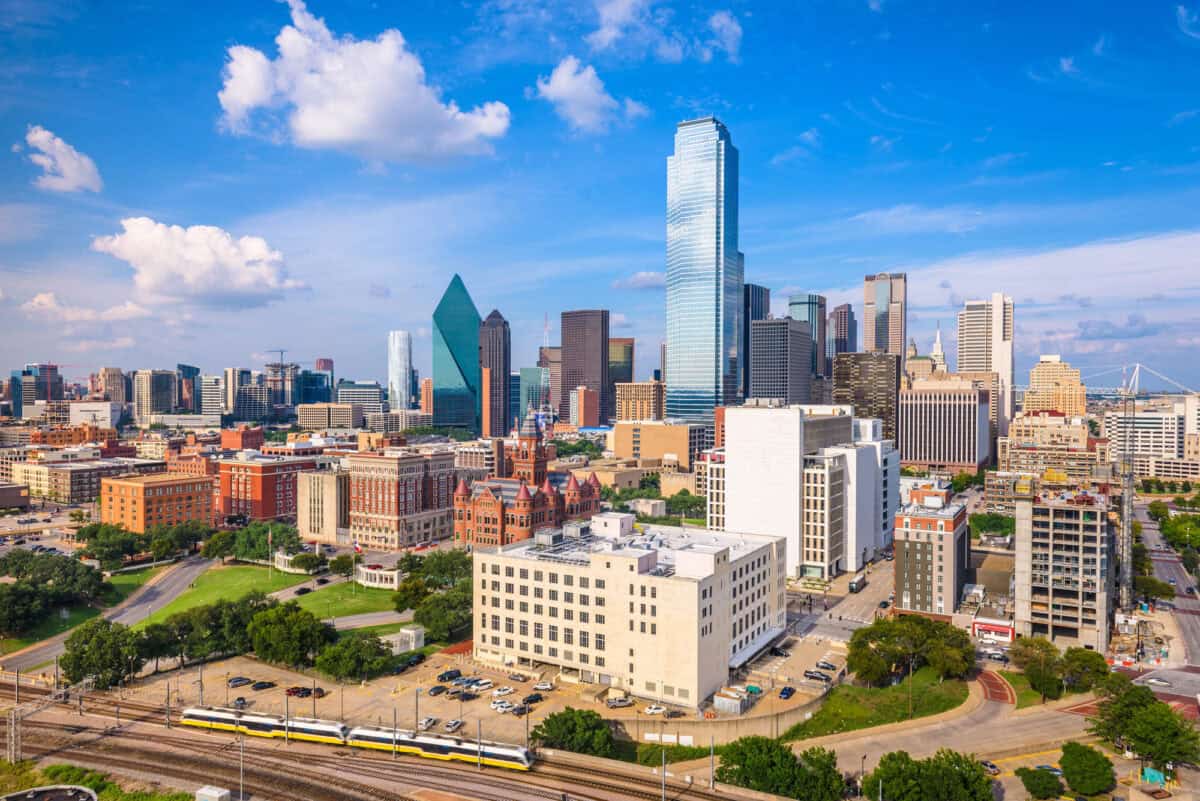
Dallas sits in a region plagued by rising ozone and extreme heat. Traffic injury and rent pressures weigh heavily on residents. Many remain uninsured, blocking access to basic preventive care. With multi‑day heat waves increasing, vulnerable groups face mounting health risks.
Why life expectancy suffers
Rising ozone exposure, extreme heat, traffic injury, and widening rent/utility burdens.
Recent signals
DFW ranks top‑10 for ozone nationally.
Multi‑day heat waves increasing ER visits.
Cost & access pressures
Rent and energy burdens; many uninsured adults/children.
What would help
Ozone rules and clean fleets; cooling access; safety redesign on high‑injury corridors.
#3 San Antonio, Texas
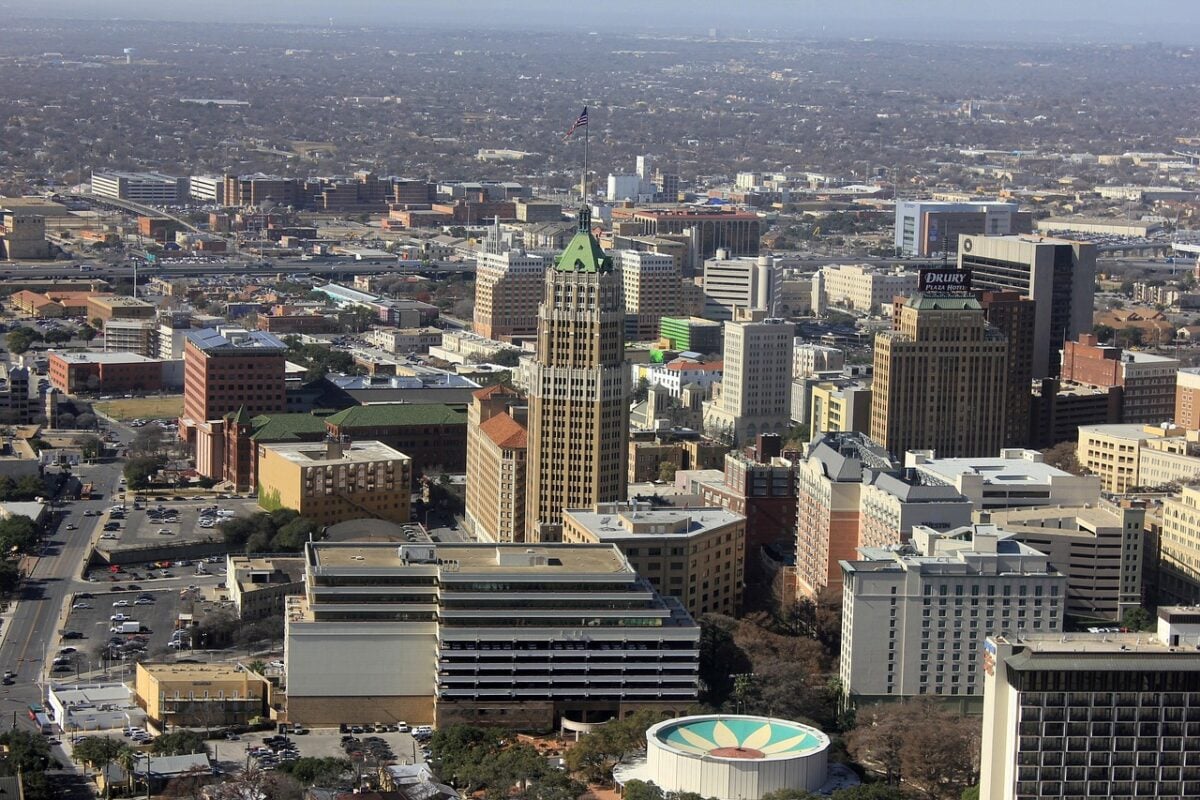
San Antonio blends history with fast growth, but health outcomes lag. Residents struggle with oppressive summer heat and poor ozone levels. Pedestrian safety is a persistent concern on high‑speed roads. With high uninsured rates, many households cannot afford the healthcare they need.
Why life expectancy suffers
Extreme heat, ozone days, traffic injury, and high uninsured rates.
Recent signals
- Record heat summers straining EMS; ozone exceedances on hot, stagnant days.
- Pedestrian risk on fast arterials.
- Cost & access pressures
- Rent/energy burden; many uninsured households; limited shade.
What would help
Heat‑resilience (cooling centers/tree canopy); Vision Zero projects; coverage navigation.
#2 Fort Worth, Texas
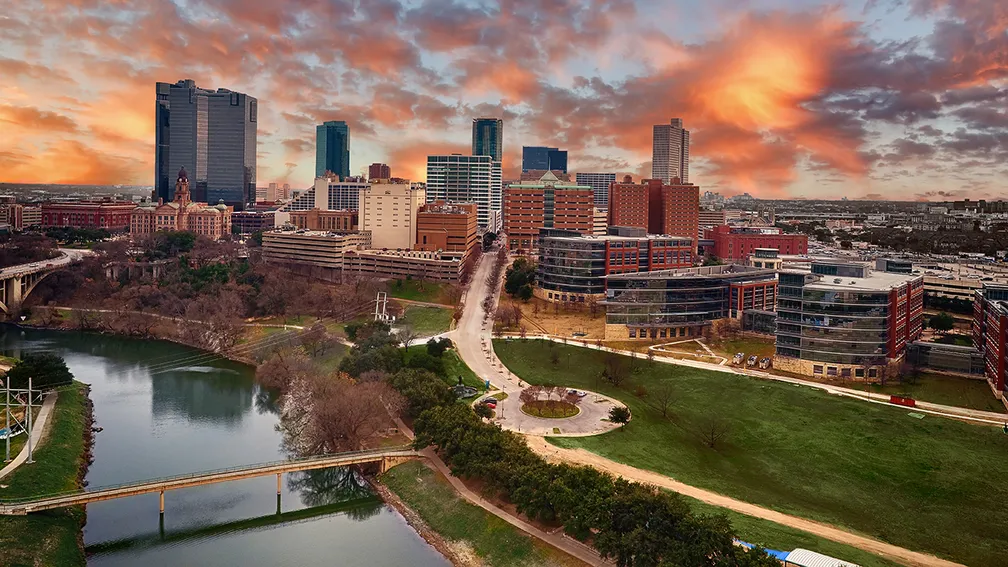
Fort Worth shares Dallas’s regional air‑quality challenges. Ozone exposure and extreme heat push many into emergency care each summer. Rent and transportation costs stretch families thin. Uninsured residents remain particularly vulnerable to preventable disease.
Why life expectancy suffers
- Shares the DFW ozone burden and heat extremes, traffic injury a persistent issue.
- Recent signals
- Ozone nonattainment persists; heat ER visits rising in summer surges.
- Cost & access pressures
- High energy and transport costs; underinsurance/uninsurance limit care.
What would help
Clean freight and transit; shaded sidewalks; primary‑care expansion.
#1 Phoenix, Arizona

Phoenix has become the epicenter of America’s extreme‑heat crisis. Record‑breaking summers now claim hundreds of lives annually. Ozone and dust storms compound respiratory strain. Long commutes and pedestrian dangers add daily hazards to life in the desert city.
Why life expectancy suffers
- Extreme heat (nation‑leading heat illness), high ozone, dust, and fast roads.
- Recent signals
- Record hot summers, ozone among the nation’s worst.
- Heat‑related ED visits among the highest nationally.
- Cost & access pressures
- High cooling bills/energy burden; housing costs; outdoor‑work exposure.
What would help
Cooling access mandates; shade/trees; high‑risk worker protections; ozone controls.
The harsh reality revealed in this list of 30 cities where you’re most likely to die younger in 2025 underscores how deeply environment, healthcare access, poverty, and lifestyle factors shape life expectancy in America. From major urban centers like Chicago and Philadelphia to smaller cities like Birmingham and Baton Rouge, common threads emerge: violence, chronic disease, pollution, and inequities in resources continue to cut lives short. Yet, the story is not without hope. Many of these cities are investing in community health programs, infrastructure improvements, and grassroots initiatives aimed at reversing these troubling trends. Recognizing the patterns is the first step toward change—because understanding why certain places struggle with lower longevity can help pave the way for healthier, safer, and longer lives for future generations.

From exploring the marine wonders in the Azores and witnessing the vast savannas of Kenya, to delving deep into the rich biodiversity of South Africa and traversing iconic landscapes in Australia and the US like Yellowstone, Chris's experiences are vast.
With a penchant for diving alongside sharks, the ocean holds a special place in his heart.
Through his academic insights, he champions wildlife conservation, striving with 'Animals Around The Globe' to cultivate a profound connection between humans and animals, enhancing our mutual appreciation.
Connect with him at Feedback@animalsaroundtheglobe.com.
- The 23 US Cities Where You’re Most Likely to Die Younger — 2025 - July 18, 2026
- What Happens to Male Chicks in Egg Farming? - July 18, 2026
- How Close Are We to Cloning the Woolly Mammoth? - July 18, 2026